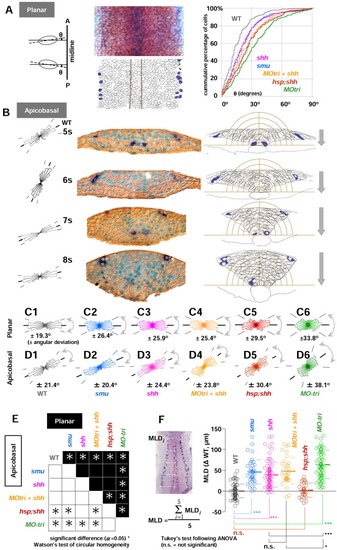
Hh signalling controls elongation polarity of the cells in the neural keel. Embryos fixed between the 4- to 10-somite stages were stained with isl1 (blue)/myoD (red) in situ hybridization followed by β-catenin immunohistochemistry (IHC; overstained in brown). A: Planar cell elongation polarity was analyzed in the dorsal view of the embryos in flat preparation (removed from the yolk cells) at the focal plane that cover the whole neural keel from the medial to the lateralmost regions. An ellipse was fitted to an individual cell, and the angle ({theta}) between each major axis of the cell and the dorsal midline was measured (left and middle panels). The cumulative percentage of cells was calculated in the neural keel as a function of planar cell elongation polarity estimated by {theta} (right panel). MO-tri embryos (green line) are the most affected phenotype, far away from the line for uninjected controls (wild-type [WT], gray line). All the other phenotypes lie between uninjected WT controls and MO-tri embryos: shh (pink line), smu homozygotes (blue), MO-tri/shh embryos (yellow orange), and hsp;shh embryos (brown line). B: Transverse sections of WT embryos (5- to 8-somite stages) are shown in the middle panel. Embryos were stained with isl1 (dark blue)/myoD (red; lost during embedding) followed by β-catenin immunohistochemistry and counterstaining of the nuclei with truidine blue (turquoise). Apicobasal cell polarity analyses were used with both left and right wings of the keel. The right half of the data were flipped horizontally, pooled with the left, and shown in the orientation of the left wing (left). Average orientations of apicobasal axes relative to the midline are 29.7° (5 som), 64.3° (6 som), 21.5° (7 som), and 13.0° (8 som). Examples of freehand outlines used for the analyses are shown on the right panel. The intervals of concentric half-rings centered at the medial floor plate are 10 μm. The neural keel sinks at the rate of 20 μm/ hr. Lateral isl1-RB neurons are found outside of the outermost ring with a radius of 60 μm. C,D: Angular deviation (circular standard deviation) of planar (C) and apicobasal (D) cell elongation polarity. From left to right: WT (gray), smu (blue), shh (pink), MO-tri/shh (yellow orange), hsp;shh (brown), and MO-tri (green). E: Summary of the circular homogeneity test between two groups. Results from planar polarity are shown in the upper half (black) and apicobasal in the lower half (white background). Asterisks are plotted at the intersection of orthogonally arranged pairs of groups, if Watson′s two-sample test for circular homogeneity at the significance level α of 0.05 rejected a null hypothesis that distribution of circular data between two groups are identical. F: Mediolateral distance (MLD) becomes narrower (smaller) as embryos develop. MLD is calculated as a mean length (μm) of five equally spaced measurements on either side of embryos along the anterior-posterior length of the trunk region, as shown in the left photo with five white bars. Measurements of MLDs from various stages during the neural keel stage (11-14 hpf) were collected with WT, smu homozygotes, shh mRNA-injected embryos, MO-tri/shh embryos, hsp;shh embryos and MO-tri embryos. To focus on the MLD-difference from uninjected WT controls, MLD data from each embryo were subtracted with the mean value of uninjected control WT embryos at the identical developmental stage with the same number of somites. Subtracted MLD values ({delta}WT in μm) for each group were pooled and shown as a dot plot with mean (thick line) and standard deviation (SD, thin lines for upper and lower limits) on the direct right. P values from statistical analysis by Tukey′s multiple comparison test after one-way analysis of variance are shown with symbols: ***, P < 0.001; *, P < 0.05; and n.s. (not significant), P > 0.05. Note that MLDs in hsp;shh embryos showed no significant difference from WT embryos, despite their defects in both planar and apicobasal cell elongation polarities. Sample size: wild-type (n = 88); smu (n = 38); shh mRNA (n = 87); MO-tri/shh (n = 34); hsp;shh (n = 30) MO-tri/stbm (n = 76).
|
