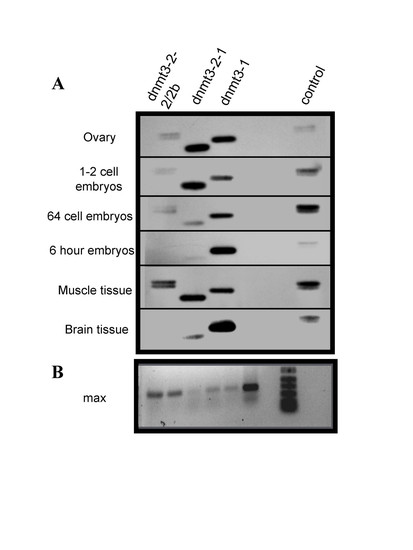
dnmt3 isoforms. A) RT-PCR followed by agarose gel electrophoresis and hybridization with a biotin-labelled probe. Stages/tissues used are labelled on the left side of figure. The first lane in all cases contains a doublet representing the two splice variants of dnmt3-2 differing in size by 78 bp. The second lane shows the alternate translational start site variant of dnmt3-2. The third lane is the product of the primers specific for gene 1 and the last lane is a control reaction loaded on each gel to allow comparisons between gels. The amount of reaction loaded was not the same in all lanes but was varied to produce more equivalent band intensities for more accurate quantification. Controls lacking reverse transcriptions produced no amplification products (not shown). B) RT-PCR of a constitutively expressed gene, max, for each RNA used serving as an internal standard for quantification. Lanes 1–6 show the max amplicons generated from the samples used in panel (A), ovaries through to brain. Lane 7 contains size markers.
|
