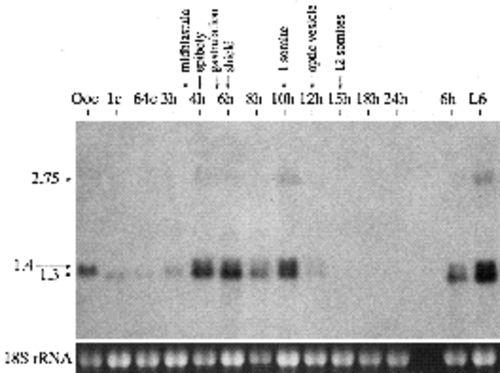
Northern blot analysis of goosecoid expression in oocytes, staged embryos and LiCl-treated embryos. 4 μg samples of total RNA from zebrafish oocytes (mixed stages) and embryos of the indicated stages were fractionated on a 1% formaldehyde-agarose gel, transferred to a nylon membrane and probed with the entire 1.3 kb pZG10.3 cDNA insert. RNA concentrations were estimated from A260 measurements, and the 18S rRNA band intensities are shown at the bottom. Note that roughly three-fold less RNA was loaded in the 8 hour versus the adjacent lanes. Developmental stages correspond to hours post-fertilization except Ooc, 1c, 64c, and L6, which respectively correspond to oocytes (mixed stages), 1-cell embryos (15-30 minutes postfertilization), 64-cell embryos (2 hours postfertilization) and 6 h lithiumized embryos. Developmental landmarks and the sizes of the three major goosecoid transcripts are indicated at the top and left of the figure. Transcript sizes were calculated from the mobilities of RNA standards.
|
