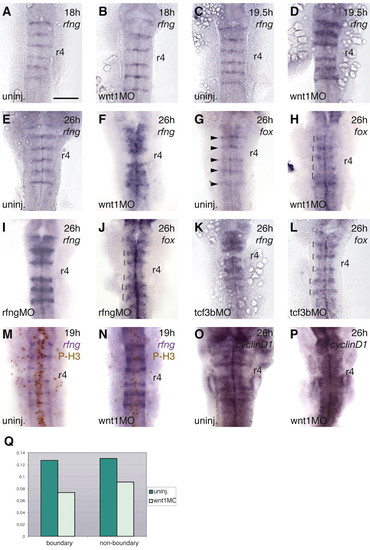
Expansion of boundary marker gene expression domains in Wnt pathway knockdowns. Markers are indicated at the top right of each panel. (A-F) Time-course of the effect of wnt1 morpholino (MO) on rfng expression. No difference between uninjected (uninj) and wnt1 MO embryos is detected at 18 hours (13/14 embryos; A,B), but by 19.5 hours, the rfng expression domain is expanded in wnt1 MO-injected embryos (11/11 embryos; C,D). Expanded rfng and foxb1.2 (fox) boundary expression is detected in wnt1 MO embryos at 26 hours (14/14 embryos; E-H). Arrowheads in G indicate the boundary expression domain of foxb1.2; brackets in H indicate expansion of this domain in wnt1 MO embryos. Ectopic boundary marker expression does not occur in r4. (I-L) Effect of rfng (30/38 embryos; I,J) and tcf3b (48/54 embryos; K,L) knockdown on expression of boundary markers, as indicated. Brackets in J and L indicate the expanded boundary domain of foxb1.2 expression (compare with G). (M-Q) Regulation of cell proliferation by Wnt1. (M,N) Double labelling with rfng (blue signal) and anti-phosphohistone H3 (brown signal) in uninjected and wnt1 MO-injected embryos at 19 hours. (O,P) cyclinD1 is expressed at high levels in hindbrain boundaries at 24 hours in uninjected embryos but not in wnt1 MO-injected embryos. (Q) Graph of mitotic index in boundary cells (rfng expressing) and non-boundary cells in uninjected and wnt1 MO 19-hour embryos. This was calculated by counting the total number of cells and the number of mitotic cells in the hindbrain of uninjected (n=14 embryos) and wnt1 MO-injected embryos (n=24). The total cell number in the hindbrain of wnt1 MO embryos is 84% of that of uninjected embryos. In wnt1 MO embryos the mitotic index was decreased by 42% in boundary regions and 30% in non-boundary regions. Scale bar: 100 µm
|
