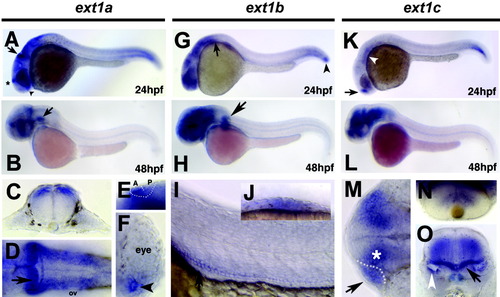
Figure 4. Expression of ext1a (A-F), ext1b (G-J), and ext1c (K-O) at 24 hr postfertilization (hpf) (A-G,I-K,M) and 48 hpf (B,H,L,N,O). A: Neural expression of ext1a can be detected in the cerebellum (arrow), the dorsal diencephalon (asterisk) and the optic stalk (arrowhead). B: Expression in the otic vesicle (black arrow). C: Cross-section of the embryo in A at the level of the anterior spinal cord. D: Dorsal view of the embryo in A at the level of the cerebellum (black arrow) and hindbrain. Ov, otic vesicle. E: Dorsal diencephalon (outlined with white dots; A, anterior, P, posterior). F: Cross-section through the eye. Black arrowhead marks optic stalk. G: Expression of ext1b in the tailbud region (arrowhead) and in anterior neural tissue (arrow). H: The fins (black arrow) express ext1b. I: Close up of cells belonging to the anterior pronephric duct (black arrow). J: Close up of the fin bud mesenchyme. K: Transcripts of ext1c can be detected in the telencephalon (black arrow) and in the rhombomeres (white arrowhead). L: Expression is confined to the brain. M: Telencephalon (white asterisk) and the olfactory bulbs (marked by arrow and outlined by dotted white line) of the embryo in A show ext1c expression. N: Expression of ext1c in the retina. O: Cross-section of the embryo in L at the level of the otic vesicles (white arrowhead). The white matter is marked by black arrow.
|
