
- Title
-
Microbial Polysaccharides Extracted from Different Mature Muds of the Euganean Thermal District Show Similar Anti-Inflammatory Activity In Vivo
- Authors
- Caichiolo, M., Zampieri, R.M., Adessi, A., Ciani, M., Caldara, F., Dalla Valle, L., La Rocca, N.
- Source
- Full text @ Int. J. Mol. Sci.
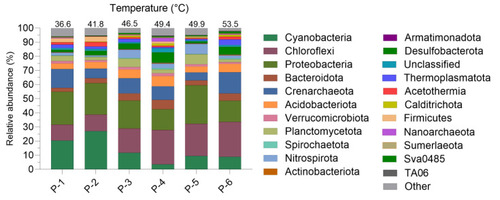
Relative abundance of the main phyla identified in the mature mud microbiota at different temperatures and sampling sites. Phyla with abundance lower than 0.05% were grouped and are displayed as Other. |
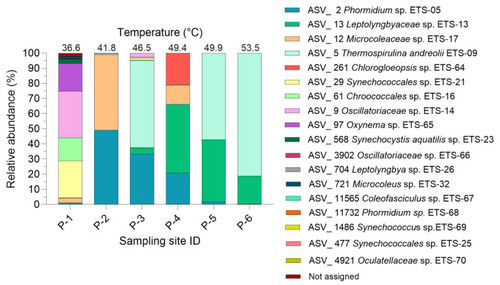
Relative abundance of the main Cyanobacteria ASVs identified in the mature mud microbiota at different temperatures and sampling sites. Only Cyanobacteria with abundance higher than 0.01% are shown. |
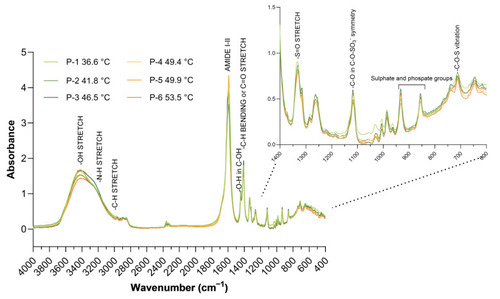
The FT-IR spectra of M-PSs extracted from mature muds, pressed into KBr pellets. With different colours are indicated M-PSs of different spas with the relative temperature of maturation of their muds. |

Monosaccharide composition and sulphate content of the six M-PSs extracted from mature muds, reported as molar percentages (mol%) and |
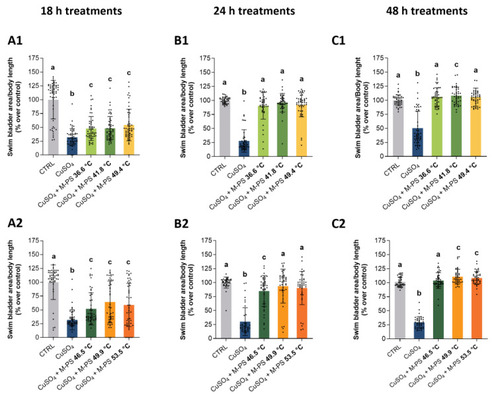
Recovering of normal developmental parameters of swim bladder area on larvae treated with M-PS after CuSO4·5H2O induced inflammation at 3 dpf. ( |
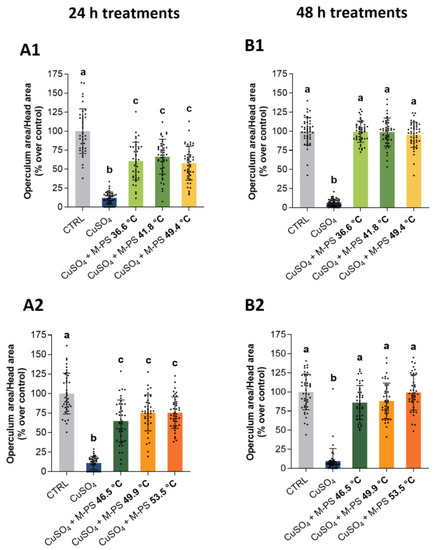
Recovering of normal developmental parameters of operculum bone area on larvae treated with M-PS after CuSO4·5H2O induced inflammation at 3 dpf. ( |
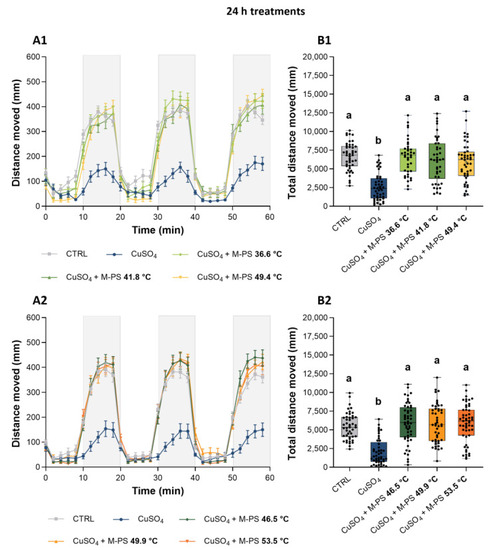
Analysis of locomotor activity of larvae treated with M-PS after CuSO4·5H2O inflammation at 3 dpf. ( |
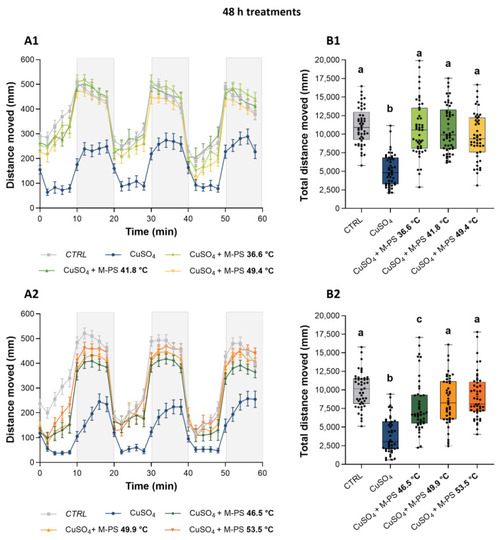
Analysis of locomotor activity of larvae treated with M-PS after CuSO4·5H2O inflammation at 3 dpf. ( |