IMAGE

Figure 6

ID
ZDB-IMAGE-240513-111
Source
Figures for Caichiolo et al., 2024
Image
Figure Caption

Figure 6

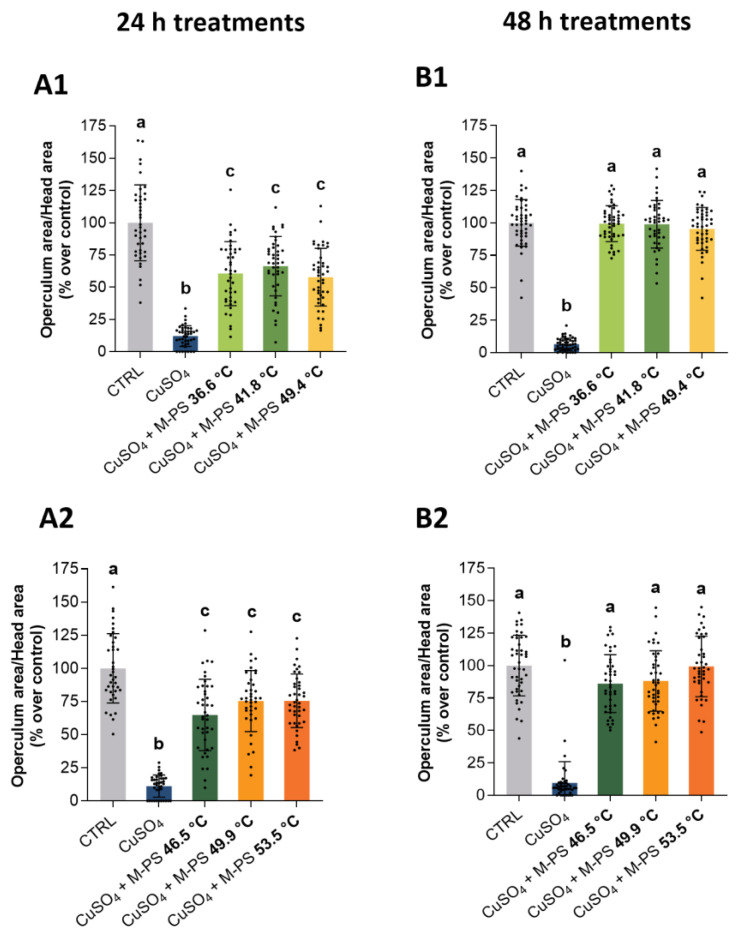
Recovering of normal developmental parameters of operculum bone area on larvae treated with M-PS after CuSO4·5H2O induced inflammation at 3 dpf. (A1,A2) Recovery from inflammation after 24 h of treatment with M-PSs extract from mud maturated at 36.6, 41.8, 49.4 °C (A1) and 46.5, 49.9, 53.5 °C (A2). (B1,B2) Recovery from inflammation after 48 h of treatment with M-PSs extract from mud maturated at 36.6, 41.8, 49.4 °C (B1) and 46.5, 49.9, 53.5 °C (B2). Data are compared to control values. The operculum bone area is normalized over total head area and indicated as percentages over control. Black bars represent the mean ± SD of three independent experiments conducted with 15–20 larvae per treatment. Statistical analysis was performed using GraphPad Prism 10 (Brown–Forsythe and Welch ANOVA test followed by Dunnett’s T3 multiple comparisons test with individual variances computed for each comparison). Statistical significance was set at p < 0.05 and the results of the multiple comparisons are shown with letters (different letters show differences among data). The exact adjusted p values are listed in Tables S6 and S7.

Acknowledgments
This image is the copyrighted work of the attributed author or publisher, and ZFIN has permission only to display this image to its users. Additional permissions should be obtained from the applicable author or publisher of the image. Full text @ Int. J. Mol. Sci.