- Title
-
Phototoxicity avoidance is a potential therapeutic approach for retinal dystrophy caused by EYS dysfunction
- Authors
- Otsuka, Y., Imamura, K., Oishi, A., Asakawa, K., Kondo, T., Nakai, R., Suga, M., Inoue, I., Sagara, Y., Tsukita, K., Teranaka, K., Nishimura, Y., Watanabe, A., Umeyama, K., Okushima, N., Mitani, K., Nagashima, H., Kawakami, K., Muguruma, K., Tsujikawa, A., Inoue, H.
- Source
- Full text @ JCI Insight
|
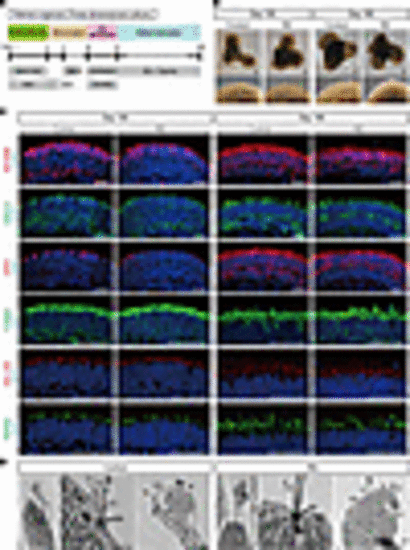
Generation of retinal organoids from human iPSCs. (A) Differentiation protocol to generate retinal organoids. Feeder-free human iPSCs were preconditioned 1 day before the differentiation. Serum-free floating culture of embryoid body–like (EB-like) aggregates with the quick aggregation (SFEBq) method (see Methods) was employed. SAG, smoothened agonist; RA, retinoic acid; RPE, retinal pigment epithelium. (B) Bright-field view of differentiated retinal organoids on day 100 and day 180. Lower panels are higher-magnification images of the dotted boxes in the upper panels. Scale bars: 200 μm. (C) Representative immunofluorescence images of retinal organoids on day 100 and day 180 stained for the panphotoreceptor marker recoverin (RCVRN), rod cell marker arrestin 1 (ARR1), cone cell marker G protein subunit α transducin 2 (GNAT2), mitochondrial marker translocase of outer mitochondrial membrane 20 (TOM20), cilia marker ADP ribosylation factor–like GTPase 13B (ARL13B), and outer segment marker peripherin 2 (PRPH2). Scale bars: 50 μm. (D) Scanning electron microscopy images of photoreceptor cells in retinal organoids on day 180. Middle and right panels are higher-magnification images of the dotted boxes in the left panels. BB, basal body; CC, connecting cilium; DS, disc stack; IS, inner segment; OS, outer segment. Scale bars: 1 μm. |
|
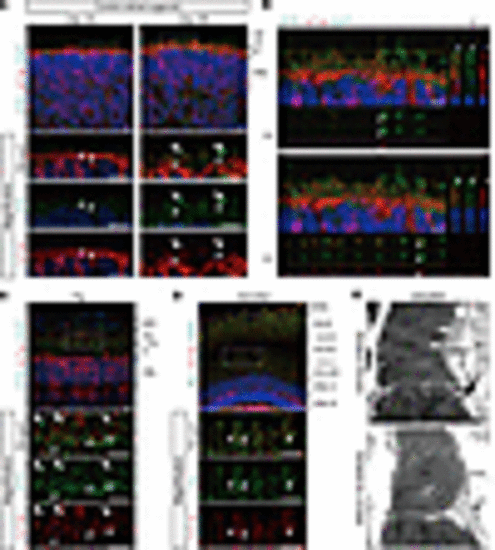
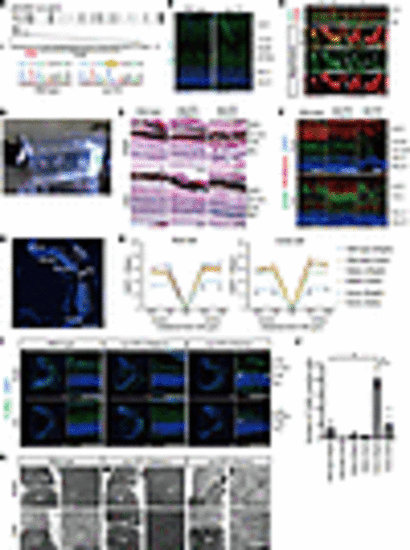
EYS localization in human retinal organoids, pig, and zebrafish. (A) Representative immunofluorescence images of control retinal organoids on day 100 and day 180 stained for EYS and acetylated α-tubulin (AcTub). Lower panels are higher-magnification images of the dotted boxes in the upper panels. White arrowheads indicate the CC, and white arrows indicate the nascent OS. ONL, outer nuclear layer. Scale bars: 10 μm. (B) Two representative immunostaining images of control retinal organoids on day 180, using orthogonal projections. EYS immunoreactivity colocalized with AcTub (white arrowheads). Scale bars: 10 μm. (C) Representative immunohistochemistry images of EYS and AcTub in WT pig retina. Lower panels are higher-magnification images of the dotted box in the upper panel. White arrowheads indicate the CC, and white arrows indicate the OS. RPE, retinal pigment epithelium. Scale bars: 10 μm. (D) Representative immunohistochemistry images of Eys and AcTub in WT zebrafish retina. Lower panels are higher-magnification images of the dotted box in the upper panel. White arrowheads indicate the CC. CC-C, cone CC; CC-R, rod CC; ONL-C, cone ONL; ONL-R, rod ONL; OS-DC, double cone outer segment; OS-LSC, long single cone outer segment; OS-R, rod outer segment. Scale bars: 10 μm. (E) Representative immunoelectron microscopy images of WT zebrafish retina. Upper panel shows staining with anti-Eys antibody. Negative control without the primary antibody is shown in the lower panel. AOS, accessory outer segment. Scale bars: 500 nm. |
|
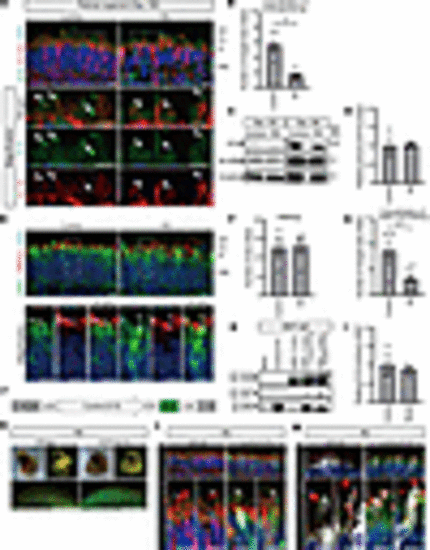
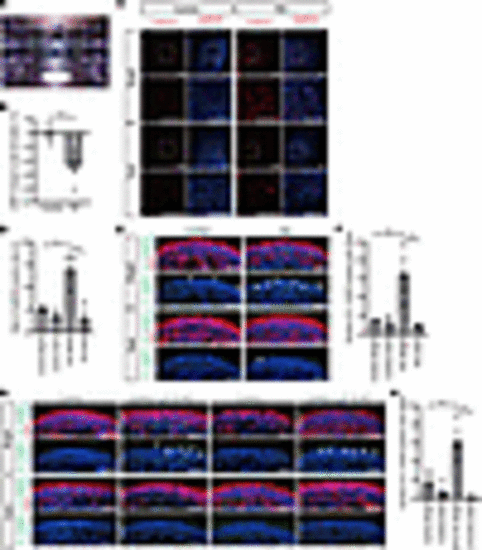
RD retinal organoids exhibited mislocalization of EYS and GRK7 in connecting cilia and outer segment. (A) Representative immunofluorescence images of EYS and acetylated α-tubulin (AcTub) in control and RD retinal organoids on day 180. Lower panels are higher-magnification images of the dotted boxes in the upper panels. White arrows indicate the CC and nascent OS. Scale bars: 10 μm. (B) Quantitative analysis of merged immunoreactivity of EYS and AcTub in control and RD retinal organoids. The y axis indicates the number of merged dots per field. Data represent mean ± SEM (n = 6 organoids). An unpaired, 2-tailed t test was used for statistical comparison (*P < 0.05). (C) Western blot analysis of EYS and RCVRN in control and RD retinal organoids on day 100 and day 180. Full-length pictures of the blots are presented in Supplemental Figure 8, A–F. (D) Quantification of Western blot bands in C. The y axis indicates the relative amount of intracellular EYS protein. Data represent mean ± SEM from independent experiments (n = 3). An unpaired, 2-tailed t test was used for statistical comparison (P = 0.92). (E) Representative immunofluorescence images of GRK7 and OS marker PRPH2 in control and RD retinal organoids on day 180. Lower panels are higher-magnification images of the dotted boxes in the upper panels. White arrows indicate the OS region. Scale bars: 10 μm. (F) Quantitative analysis of PRPH2 immunoreactivity in control and RD retinal organoids in E. The y axis indicates the number of reactive dots per field. Data represent mean ± SEM (n = 6 organoids). An unpaired, 2-tailed t test was used for statistical comparison (P = 0.87). (G) Quantitative analysis of merged immunoreactivity of PRPH2 and GRK7 in control and RD retinal organoids in E. The y axis indicates the number of reactive dots per field. Data represent mean ± SEM (n = 6 organoids). An unpaired, 2-tailed t test was used for statistical comparison (*P < 0.05). (H) Biochemical interactions between EYS and GRK7. 293T cell lysates were subjected to immunoprecipitation (IP) using anti-FLAG antibody and immunoblotted (IB) with antibodies against FLAG (top) or EYS (middle and bottom). A full-length picture of the blot is presented in Supplemental Figure 9. (I) Quantification of IB bands in H. The y axis indicates the relative amount of control or mutant EYS binding to GRK7. Data represent mean ± SEM from independent experiments (n = 3). An unpaired, 2-tailed t test was used for statistical comparison (P = 0.69). (J) Schematic of helper-dependent adenoviral vector containing control EYS. IRES, internal ribosome entry site; ITR, inverted terminal repeats; pac, packaging signal; stuffer, stuffer DNA. (K) Bright-field and EGFP fluorescence of RD organoids 48 hours after adenoviral infection. Scale bars: 200 μm. (L) Representative immunofluorescence images of GFP, EYS, and AcTub in RD retinal organoids after control EYS introduction with adenoviral vector. Lower panels are higher-magnification images of the dotted boxes in the upper panels. White arrows indicate the CC and nascent outer segment OS. Scale bars: 10 μm. (M) Representative immunofluorescence images of GFP, GRK7, and PRPH2 in RD retinal organoids after control EYS introduction with adenoviral vector. Lower panels are higher-magnification images of the dotted boxes in the upper panels. White arrows indicate the nascent OS. Scale bars: 10 μm. |
|
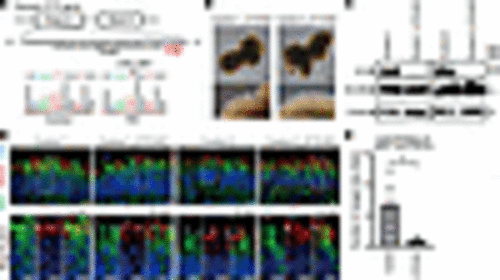
Generation of EYS-KO iPSCs with CRISPR/Cas9 system. (A) Target sequence of CRSPR/Cas9 gene editing is located in exon 4 of the EYS gene. Sanger sequencing of edited iPSCs shows single base deletion (c.621 delT). (B) Bright-field view of EYS-KO retinal organoids on day 180. Lower panels are higher-magnification images of the dotted boxes in the upper panels. Scale bars: 200 μm. (C) Western blot analysis of EYS and RCVRN in control and EYS-KO retinal organoids on day 180. Full-length pictures of the blots are presented in Supplemental Figure 8, G–L. (D) Representative immunofluorescence images of GRK7 and OS marker PRPH2 in control and EYS-KO retinal organoids on day 180. Lower panels are higher-magnification images of the dotted boxes in the upper panels. White arrows indicate the OS region. Scale bars: 10 μm. (E) Quantitative analysis of merged immunoreactivity of PRPH2 and GRK7 in control and EYS-KO retinal organoids in D. The y axis indicates the number of reactive dots per field. Data represent mean ± SEM (n = 3 organoids). An unpaired, 2-tailed t test was used for statistical comparison (*P < 0.05). |
|
eys-KO zebrafish exhibited GRK7 mislocalization in outer segment and light-induced photoreceptor cell death. (A) Generation of eys-KO zebrafish with CRISPR/Cas9 technology. The zebrafish eys genomic structure is shown. The protospacer-adjacent motifs (PAMs) and crRNA targeting sequences in exon 2 are underlined. Sanger sequencing identified a 2–base pair insertion in eys-KO zebrafish. (B) Representative Eys immunostaining images of WT and eys-KO zebrafish. No punctate staining in photoreceptor cells was observed in eys-KO zebrafish. CC-C, cone connecting cilium; CC-R, rod connecting cilium; ONL-C, cone outer nuclear layer; ONL-R, rod outer nuclear layer; OS-DC, double cone outer segment; OS-LSC, long single cone outer segment; OS-R, rod outer segment. Scale bars: 20 μm. (C) Images of WT and eys-KO zebrafish immunostained for Grk7 and OS marker Gnat2. Lower panels are higher-magnification images of the dotted boxes in the upper panels. White arrowheads indicate the CC, and white arrows indicate the OS. OS-C, cone outer segment. Scale bars: 10 μm. (D) Three-month-postfertilization WT and eys-KO (heterozygous and homozygous) zebrafish were exposed to white LED light. (E) Retinal sections of WT and eys-KO (heterozygous and homozygous) zebrafish after light stimulation (Bright) or dark adaptation (Dark) were stained with hematoxylin and eosin. Scale bars: 50 μm. (F) Representative immunohistochemistry of light-stimulated or dark-adapted WT and eys-KO (heterozygous and homozygous) zebrafish. Rhodopsin and Gnat2 identify rod OS and cone OS, respectively. Scale bars: 20 μm. (G) Method for counting the number of rod or cone nuclei in light-stimulated or dark-adapted zebrafish. Dotted boxes show areas with a width of 100 μm. Dorsal and ventral areas 150 or 300 μm from the center of optic nerve (ON) were evaluated. Scale bar: 200 μm. (H) Quantification of rod or cone cell numbers by nuclei counting in light-stimulated or dark-adapted WT and eys-KO (heterozygous and homozygous) zebrafish. The x axis indicates the distance from the ON. The y axis indicates the number of nuclei within a range of 100 μm. One-way ANOVA with Dunnett’s post hoc test was used for statistical comparison (*P < 0.05). Data represent mean ± SEM (n = 3). (I) Representative TUNEL staining images of WT and eys-KO zebrafish after light stimulation or dark adaptation. White arrowheads indicate TUNEL-positive cells. Scale bars: 100 μm. (J) The number of TUNEL-positive cells was quantified in each zebrafish after light exposure or dark adaptation. The y axis indicates the number of TUNEL-positive cells per eye. Data represent mean ± SEM (n = 3). One-way ANOVA with Dunnett’s post hoc test was used for statistical comparison (*P < 0.05). (K) Representative transmission electron microscopy images of photoreceptor cells in WT and eys-KO (heterozygous and homozygous) zebrafish. Right panels are higher-magnification images of the OS in the dotted boxes in the left panels. Scale bars: 500 nm. |
|
Light overresponse and photoreceptor cell death after light irradiation in RD retinal organoids. (A) Retinal organoids were exposed to white LED light on day 180. (B) Intracellular cGMP concentration was measured by ELISA. Percentage changes in cGMP concentration by light stimulation in control and RD retinal organoids are shown. Data represent mean ± SEM from independent experiments (n = 6). An unpaired, 2-tailed t test was used for statistical comparison (*P < 0.05). (C) Representative images of reactive oxygen species (ROS) stained with CellROX in control and RD retinal organoids. Twenty-four-hour light-stimulated (Bright) or dark-adapted (Dark) organoids on day 180 were evaluated. The lower panels are higher-magnification images of the dotted boxes in the upper panels. Scale bars: 100 μm. (D) Quantification of the data in C. The y axis indicates the ratio of CellROX-positive cells. Data represent mean ± SD from 3 retinal organoids. One-way ANOVA with Dunnett’s post hoc test was used for statistical comparison (*P < 0.05). (E) Representative immunofluorescence images of photoreceptor marker ARR1 and cleaved caspase-3 (Cl. CASP3) in retinal organoids after light exposure or dark adaptation. White arrowheads indicate cleaved caspase-3–positive cells. Scale bars: 50 μm. (F) Quantification of the data in E. The y axis indicates the number of cleaved caspase-3–positive cells per field. Data represent mean ± SEM from 3 retinal organoids. One-way ANOVA with Dunnett’s post hoc test was used for statistical comparison (*P < 0.05). (G) Representative immunofluorescence images of ARR1 and cleaved caspase-3 in control and EYS-KO retinal organoids after light exposure or dark adaptation. White arrowheads indicate cleaved caspase-3–positive cells. Scale bars: 50 μm. (H) Quantification of the data in G. The y axis indicates the number of cleaved caspase-3–positive cells per field. Data represent mean ± SEM from 3 retinal organoids. One-way ANOVA with Dunnett’s post hoc test was used for statistical comparison (*P < 0.05). |
|
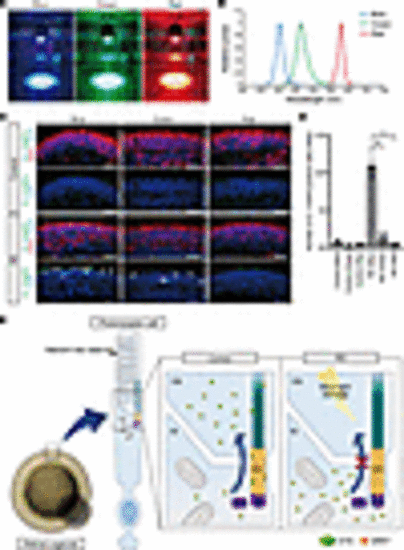
The effect of light wavelength on photoreceptor cell death in retinal organoids. (A) Retinal organoids were exposed to blue, green, or red LED light on day 180 for 24 hours. (B) The peak wavelengths of blue, green, and red lights were 454, 514, and 628 nm, respectively. (C) Representative immunofluorescence images of photoreceptor marker (ARR1) and cleaved caspase-3 (Cl. CASP3) in control and RD retinal organoids after exposure to each LED light. White arrowheads indicate cleaved caspase-3–positive cells. Scale bars: 50 μm. (D) Quantification of the data in C. The y axis indicates the number of cleaved caspase-3–positive cells per field. Data represent mean ± SEM from 3 retinal organoids. One-way ANOVA with Dunnett’s post hoc test was used for statistical comparison (*P < 0.05). (E) Schematic representation of putative mechanism of EYS-RD. EYS interacts with GRK7 and transports it from the IS to the OS. In control photoreceptor cells, EYS can localize at the CC and OS, whereas in RD, EYS with GRK7 cannot distribute to these regions. Light-induced damage via excessive reactive oxygen species production is caused by the mislocalization of mutant EYS with GRK7. |

