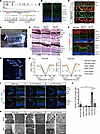
Fig. 5 eys-KO zebrafish exhibited GRK7 mislocalization in outer segment and light-induced photoreceptor cell death. (A) Generation of eys-KO zebrafish with CRISPR/Cas9 technology. The zebrafish eys genomic structure is shown. The protospacer-adjacent motifs (PAMs) and crRNA targeting sequences in exon 2 are underlined. Sanger sequencing identified a 2–base pair insertion in eys-KO zebrafish. (B) Representative Eys immunostaining images of WT and eys-KO zebrafish. No punctate staining in photoreceptor cells was observed in eys-KO zebrafish. CC-C, cone connecting cilium; CC-R, rod connecting cilium; ONL-C, cone outer nuclear layer; ONL-R, rod outer nuclear layer; OS-DC, double cone outer segment; OS-LSC, long single cone outer segment; OS-R, rod outer segment. Scale bars: 20 μm. (C) Images of WT and eys-KO zebrafish immunostained for Grk7 and OS marker Gnat2. Lower panels are higher-magnification images of the dotted boxes in the upper panels. White arrowheads indicate the CC, and white arrows indicate the OS. OS-C, cone outer segment. Scale bars: 10 μm. (D) Three-month-postfertilization WT and eys-KO (heterozygous and homozygous) zebrafish were exposed to white LED light. (E) Retinal sections of WT and eys-KO (heterozygous and homozygous) zebrafish after light stimulation (Bright) or dark adaptation (Dark) were stained with hematoxylin and eosin. Scale bars: 50 μm. (F) Representative immunohistochemistry of light-stimulated or dark-adapted WT and eys-KO (heterozygous and homozygous) zebrafish. Rhodopsin and Gnat2 identify rod OS and cone OS, respectively. Scale bars: 20 μm. (G) Method for counting the number of rod or cone nuclei in light-stimulated or dark-adapted zebrafish. Dotted boxes show areas with a width of 100 μm. Dorsal and ventral areas 150 or 300 μm from the center of optic nerve (ON) were evaluated. Scale bar: 200 μm. (H) Quantification of rod or cone cell numbers by nuclei counting in light-stimulated or dark-adapted WT and eys-KO (heterozygous and homozygous) zebrafish. The x axis indicates the distance from the ON. The y axis indicates the number of nuclei within a range of 100 μm. One-way ANOVA with Dunnett’s post hoc test was used for statistical comparison (*P < 0.05). Data represent mean ± SEM (n = 3). (I) Representative TUNEL staining images of WT and eys-KO zebrafish after light stimulation or dark adaptation. White arrowheads indicate TUNEL-positive cells. Scale bars: 100 μm. (J) The number of TUNEL-positive cells was quantified in each zebrafish after light exposure or dark adaptation. The y axis indicates the number of TUNEL-positive cells per eye. Data represent mean ± SEM (n = 3). One-way ANOVA with Dunnett’s post hoc test was used for statistical comparison (*P < 0.05). (K) Representative transmission electron microscopy images of photoreceptor cells in WT and eys-KO (heterozygous and homozygous) zebrafish. Right panels are higher-magnification images of the OS in the dotted boxes in the left panels. Scale bars: 500 nm.
Image
Figure Caption
Acknowledgments
This image is the copyrighted work of the attributed author or publisher, and
ZFIN has permission only to display this image to its users.
Additional permissions should be obtained from the applicable author or publisher of the image.
Full text @ JCI Insight

