
- Title
-
Assessment of a novel NRAS in-frame tandem duplication causing a myelodysplastic/myeloproliferative neoplasm
- Authors
- Beckmann, C.C.A., Ramamoorthy, S., Trompouki, E., Driever, W., Schwarz-Furlan, S., Strahm, B., Yoshimi, A., Niemeyer, C.M., Erlacher, M., Kapp, F.G.
- Source
- Full text @ Exp. Hematol.
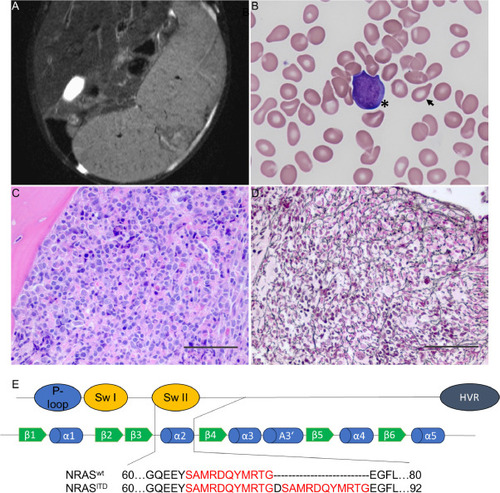
Phenotype of the affected child and the novel NRASITD mutation. (A) The 2.5-year-old child suffered from a severe hepatomegaly and especially splenomegaly as shown in the magnetic resonance image (T2 sequence with fat saturation). (B) In peripheral blood smears taken at first presentation to our clinic, blast cells (asterisk) were found as well as dacrocytes (arrow) as a sign of myelofibrosis. (C) The trephine biopsy specimen obtained showed hypercellular bone marrow (hematoxylin and eosin stain, 400 ×) with hyperplasia of a left-shifted granulopoiesis, hypoplasia of the erythropoiesis (scale bar: 50 µm), and (D) myelofibrosis (Gomori's silver staining, 400 ×, scale bar: 50 µm). (E) In the patient's bone marrow, the somatic NRASITD mutation was found by Sanger sequencing, leading to a duplication of 11 amino acids. Shown is an alignment to the GTPase NRAS Homo sapiens Sequence ID: NP 002515.1 using BLASTp (NCBI) [17,18]. The location of the duplication in correlation to the P-loop, switch I (Sw I) and switch II (Sw II) domains, and the hypervariable region (HVR) of the NRAS protein is shown. Underneath, the secondary structural elements of the NRAS protein are shown as green arrows and blue cylinders representing β-sheets and α-helices, respectively [16]. |
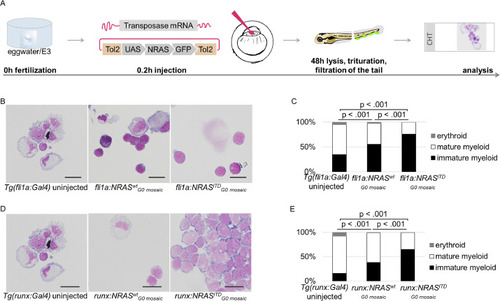
Functional assessment of NRASITD in zebrafish embryos. (A) The NRAS-plasmid was coinjected with Tol2 transposase messenger RNA (mRNA) into the single-cell embryo. Zebrafish embryos’ caudal hematopoietic tissues (CHTs) were analyzed at 48 hours post fertilization (hpf). (B) Images show CHT smears stained with May-Grünwald Giemsa (MGG) stain in fli1a:NRASITDG0mosaic, fli1a:NRASwtG0mosaic, and uninjected Tg(fli1a:Gal4) embryos at 48 hpf. Scale bar: 10 µm. (C) Shown are ratios of cell populations in CHT smears from four embryos per condition as percentages. fli1a:NRASITDG0mosaic embryos showed an increased fraction of immature myeloid cells compared with uninjected Tg(fli1a:Gal4) embryos (Χ2 [2, n=4] = 67.59, p < 0.001) as well as to fli1a:NRASwtG0mosaic (Χ2 [2, n=4] = 22.41, p < 0.001) at 48 hpf. In addition, in fli1a:NRASwtG0mosaic embryos, an immature myeloid expansion was observed compared with uninjected Tg(fli1a:Gal4) embryos (Χ2 [2, n=4] = 15.12, p < 0.001). (D) Images show CHT smears stained with MGG stain in runx:NRASITDG0mosaic, runx:NRASwtG0mosaic, and uninjected Tg(runx:Gal4) embryos at 5 days post fertilization (dpf). Scale bar: 10 µM. (E) Shown are ratios of cell populations in CHT smears from four embryos per condition as percentages. runx:NRASITDG0mosaic embryos showed an increase in the immature myeloid cell fraction compared with uninjected Tg(runx:Gal4) embryos (Χ2 [2, n=4] = 112.04, p < 0.001) at 5 dpf. In addition, in runx:NRASwtG0mosaic embryos, an immature myeloid expansion was observed compared with uninjected Tg(runx:Gal4) embryos (Χ2 [2, n=4] = 21.53, p < 0.001). |
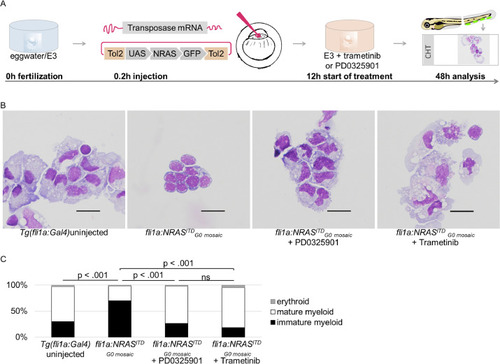
Targeted treatment in NRASITD-zebrafish embryos. (A) The NRAS-plasmid was coinjected with Tol2 transposase messenger RNA (mRNA) into the single-cell embryo. Zebrafish embryos were incubated with trametinib or PD0325901 from 12 to 48 hours post fertilization (hpf) when analysis of the caudal hematopoietic tissue (CHT) was performed. (B) Images show CHT smears stained with May-Grünwald Giemsa (MGG) stain in fli1a:NRASITDG0mosaic and uninjected Tg(fli1a:Gal4) embryos as well as trametinib- and PD0325901-treated fli1a:NRASITDG0mosaic embryos. Scale bar: 10 µm. (C) Shown are ratios of cell populations in CHT smears from four embryos per condition as percentages. fli1a:NRASITDG0mosaic embryos showed a significant increase in immature myeloid cells (Χ2 [2, n=4] = 32.14, p < 0.001). After treatment of fli1a:NRASITDG0mosaic embryos with PD0325901 as well as with trametinib, the cell fractions in the CHT showed no difference compared with uninjected Tg(fli1a:Gal4) embryos and a significant decrease in immature myeloid cells compared with fli1a:NRASITDG0mosaic embryos (Χ2 [2, n=4] = 49.78, p < 0.001) and (Χ2 [2, n=4] = 74.66, p < 0.001) for trametinib. |