
|
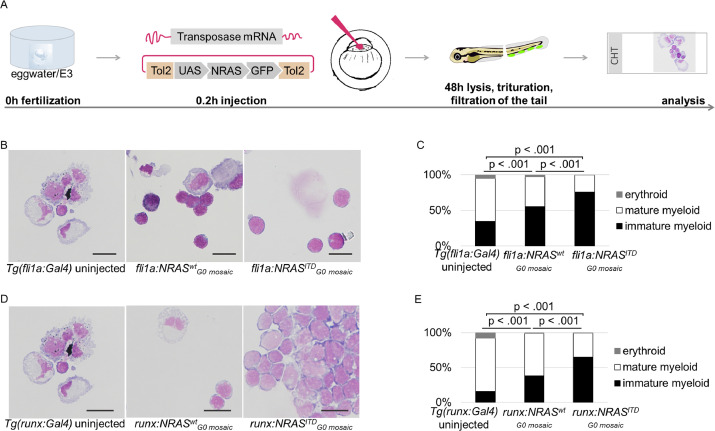
Fig. 2 Functional assessment of NRASITD in zebrafish embryos. (A) The NRAS-plasmid was coinjected with Tol2 transposase messenger RNA (mRNA) into the single-cell embryo. Zebrafish embryos’ caudal hematopoietic tissues (CHTs) were analyzed at 48 hours post fertilization (hpf). (B) Images show CHT smears stained with May-Grünwald Giemsa (MGG) stain in fli1a:NRASITDG0mosaic, fli1a:NRASwtG0mosaic, and uninjected Tg(fli1a:Gal4) embryos at 48 hpf. Scale bar: 10 µm. (C) Shown are ratios of cell populations in CHT smears from four embryos per condition as percentages. fli1a:NRASITDG0mosaic embryos showed an increased fraction of immature myeloid cells compared with uninjected Tg(fli1a:Gal4) embryos (Χ2 [2, n=4] = 67.59, p < 0.001) as well as to fli1a:NRASwtG0mosaic (Χ2 [2, n=4] = 22.41, p < 0.001) at 48 hpf. In addition, in fli1a:NRASwtG0mosaic embryos, an immature myeloid expansion was observed compared with uninjected Tg(fli1a:Gal4) embryos (Χ2 [2, n=4] = 15.12, p < 0.001). (D) Images show CHT smears stained with MGG stain in runx:NRASITDG0mosaic, runx:NRASwtG0mosaic, and uninjected Tg(runx:Gal4) embryos at 5 days post fertilization (dpf). Scale bar: 10 µM. (E) Shown are ratios of cell populations in CHT smears from four embryos per condition as percentages. runx:NRASITDG0mosaic embryos showed an increase in the immature myeloid cell fraction compared with uninjected Tg(runx:Gal4) embryos (Χ2 [2, n=4] = 112.04, p < 0.001) at 5 dpf. In addition, in runx:NRASwtG0mosaic embryos, an immature myeloid expansion was observed compared with uninjected Tg(runx:Gal4) embryos (Χ2 [2, n=4] = 21.53, p < 0.001).