
- Title
-
Transgenic tools targeting the basal ganglia reveal both evolutionary conservation and specialization of neural circuits in zebrafish
- Authors
- Tanimoto, Y., Kakinuma, H., Aoki, R., Shiraki, T., Higashijima, S.I., Okamoto, H.
- Source
- Full text @ Cell Rep.
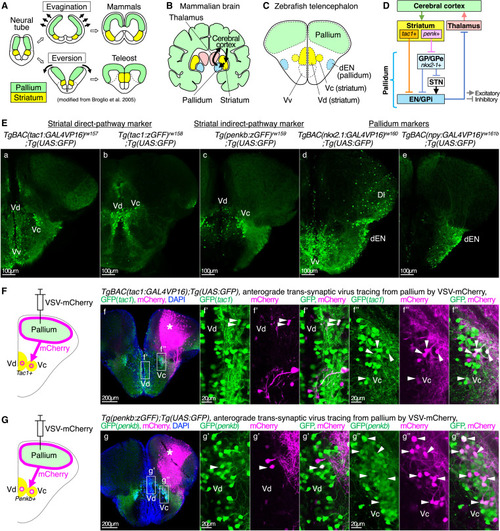
Transgenic and viral tools for anatomical characterization of specific neural subpopulations in the zebrafish basal ganglia (A) Comparison of developmental processes of the mammalian and teleost brains (modified from Broglio et al.3). Areas colored with green and yellow indicate the pallium and the striatum, respectively. (B and C) Comparison of cortico-basal ganglia circuits of the mammalian and zebrafish brains. Coronal sections are shown. The evolutionarily homologous brain regions are in the same color. Vd/Vc, dorsal/central nucleus of the ventral telencephalic area; dEN, dorsal entopeduncular nucleus; Vv, ventral nucleus of the ventral telencephalic area. (D) Schematic diagram of the mammalian cortico-basal ganglia circuit. (E) Expression patterns of the Gal4-driver lines for direct-pathway striatal neurons (tac1 promoter, a and b), indirect-pathway striatal neurons (penkb promoter, c), and pallidal neurons (nkx2.1 and npy promoters, d and e). Each Gal4-driver line was combined with Tg(UAS:GFP). Coronal sections in the anterior telencephalon are shown. Scale bars, 100 μm. (F) Illustration of a coronal section depicting VSV-mCherry injection into the pallium and anterogradely labeled tac1+ neurons in the Vd/Vc. (f) Actual results from VSV-mCherry injection into the pallium of TgBAC(tac1:GAL4VP16);Tg(UAS:GFP) fish and immunohistochemistry of GFP (green), mCherry (magenta), and DAPI (blue). An asterisk indicates an approximate injection point. Insets show the positions of f’ (focusing on Vd) and f’’ (focusing on Vc), where arrowheads indicate GFP and mCherry double-positive neurons. (f) Maximum-intensity projection (MaxIP) of the whole z stacks obtained from a histological section, whereas (f’) and (f’’) show a single confocal optical section. Scale bars, 200 μm (f) and 20 μm (f’ and f’’). (G) Same as (E), but in Tg(penkb:zGFF);Tg(UAS:GFP) fish. |
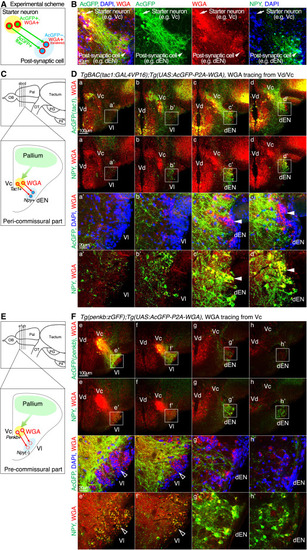
WGA tracing from the tac1+ and penkb+ striatal neurons caused WGA accumulation preferentially in the dEN and Vl, respectively (A) Schematic illustration of the WGA tracing using Tg(UAS:AcGFP-2A-WGA) in this study. Starter neurons express AcGFP and WGA, their projecting fibers mainly express AcGFP, and the neighboring post-synaptic cells accumulate anterogradely transferred WGA. (B) An example of the WGA tracing experiment from the starter neurons to the post-synaptic neurons (the same sample as c in D). Scale bar, 40 μm. (C) Illustration of a coronal section depicting WGA tracing from the tac1+ Vc neurons and trans-synaptic WGA transfer to the npy+ dEN neurons at the peri-commissural telencephalon. (Top) The lateral view of the zebrafish brain, and the dashed lines indicate antero-posterior positions of the coronal sections (a)–(d) shown in (B). OB, olfactory bulb; Pal, pallium; OT, optic tract; PG, preglomerular nucleus; Pit, pituitary. (D) WGA expression in the tac1+ Vd/Vc neurons and immunohistochemistry of AcGFP (green), WGA (red), DAPI (blue), and NPY (green). Four successive coronal sections (a–d) are shown so that the first two sections contain the NPY-negative Vl region and the latter two sections contain the NPY+ dEN region. Insets in (a)–(d) (top two rows) show the positions of (a’)–(d’) (bottom two rows), focusing on the Vl or dEN. In (c’)–(d’), arrowheads indicate representative NPY+ dEN neurons with WGA signals. Scale bars, 100 μm (a–d) and 20 μm (a’–d’). (E and F) Same as (C) and (D), but from the penkb+ Vc neurons and trans-synaptic WGA transfer to the NPY-negative Vl neurons at the pre-commissural telencephalon. In (e’)–(f’), open arrowheads indicate representative NPY-negative Vl neurons with WGA signals. |
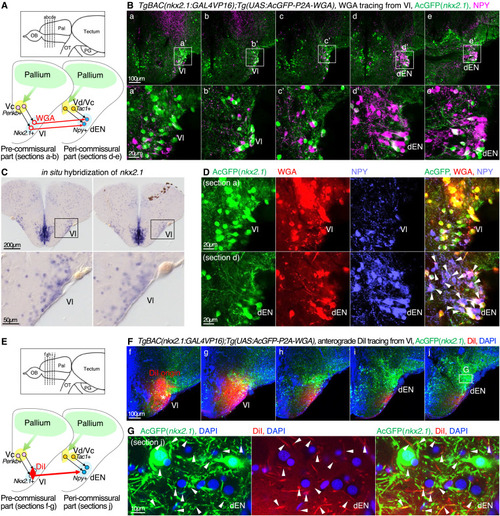
The indirect-pathway-targeted region Vl contains neurons expressing GP/GPe marker Nkx2.1 and projects to the direct-pathway-targeted region dEN (A) Illustration of coronal sections depicting WGA expression in the nkx2.1+ Vl neurons and trans-synaptic WGA transfer to the npy+ dEN neurons. (B) Different antero-posterior distributions of the nkx2.1+ neurons (AcGFP, green) and NPY+ neurons (NPY, magenta) in the five successive coronal sections (a–e). Insets in (a)–(e) show the positions of (a’)–(e’), focusing on the Vl-dEN region. Scale bars, 100 μm (a–e) and 20 μm (a’–e’). (C) ISH analysis of nkx2.1 in the Vl. Two successive coronal sections at the Vl are shown. The same animal as in Figure S1H. Scale bars, 200 μm (top panels) and 50 μm (bottom panels). (D) WGA tracing from the nkx2.1+ neurons and immunohistochemistry of AcGFP (green), WGA (red), and NPY (light blue). Upper and lower panels show the Vl (section a) and the dEN (section d), respectively. Arrowheads indicate NPY+ dEN neurons with WGA signals. Scale bars, 20 μm. (E) Illustration of coronal sections depicting anterograde DiI tracing from the Vl in TgBAC(nkx2.1:GAL4VP16);Tg(UAS:AcGFP-P2A-WGA) fish. (F) Five successive sections (f–j) of the DiI tracing from the Vl to the dEN, and multicolor imaging of AcGFP (green), DiI (red), and DAPI (blue). An inset in (e) shows the position of (G). MaxIP is shown. Scale bar, 100 μm. (G) Magnified views of the dEN (section j). Arrowheads indicate DiI and AcGFP double-positive fibers in the dEN, indicating direct projection from the nkx2.1+ Vl neurons to the dEN. Scale bar, 10 μm. |

The npy-positive inhibitory neurons in the dEN directly project to the pallium and not to the thalamus (A) Illustration of a coronal section depicting WGA expression in the npy+ dEN neurons and trans-synaptic WGA transfer to the pallial neurons. (B) Projection patterns of the npy+ neurons (AcGFP, green) to the pallium (DAPI, blue) in 12 successive coronal sections (a–n). In (d), insets show the positions of (C) and (D). MaxIP is shown. Scale bar, 200 μm. (C) WGA tracing from the npy+ dEN neurons and immunohistochemistry of AcGFP (green), WGA (red), and DAPI (blue). The left panel shows the pallium of section d, and insets show the positions of (d’)–(d’’’), focusing on the different pallial subdivisions Dm, Dc, and Dl. In (d’)–(d’’’), arrowheads indicate representative pallial neurons with WGA signals. Scale bars, 40 μm (left) and 20 μm (d’–d’’’). (D) A magnified view of the dEN-vEN region in (d). The vEN is circled with a dotted line. Scale bar, 40 μm. (E) Immunohistochemistry of gad1b+ neurons (GFP, green) and npy+ neurons (NPY, red) in TgBAC(gad1b:GAL4VP16);Tg(UAS:GFP) fish. An inset in the leftmost panel shows the position of the right three panels. NPY-immunoreactive cells were co-stained with GFP signals (rightmost panel). The leftmost panel is MaxIP. Scale bars, 200 μm (leftmost panel) and 40 μm (right three panels). |
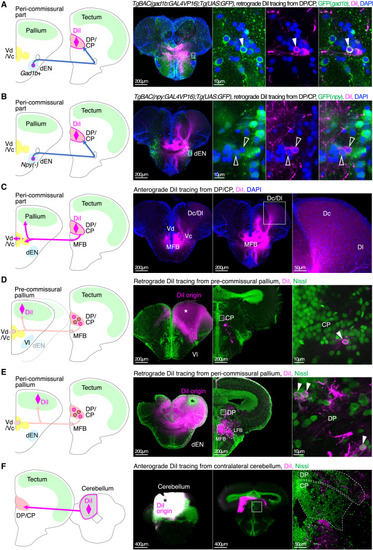
The npy-negative inhibitory dEN neurons project to the DP/CP thalamus and form the pallido-thalamo-pallial pathway (A) DiI tracing from the DP/CP in TgBAC(gad1b:GAL4VP16);Tg(UAS:GFP) fish retrogradely labeled gad1b+ dEN neurons. An inset in the leftmost panel shows the position of the right three panels. Filled arrowheads indicate retrogradely labeled gad1b+ dEN neurons. The leftmost panel is MaxIP. Scale bars, 200 μm (leftmost panel) and 10 μm (right three panels). (B) Same as (A) but in TgBAC(npy:GAL4VP16);Tg(UAS:GFP) fish. Open arrowheads indicate retrogradely labeled npy-negative dEN neurons. (C) DiI tracing from the DP/CP anterogradely labeled projection fibers in the MFB, the Dc/Dl pallium, and the Vc region. The same animal as in (B). Two peri-commissural sections are shown. An inset in the middle panel is magnified in the rightmost panel. MaxIP is shown. Scale bars, 200 μm (left two panels) and 50 μm (rightmost panel). (D) DiI tracing from the pre-commissural pallium retrogradely labeled thalamic neurons. An asterisk indicates DiI origin. An inset in the middle panel shows the position of the rightmost panel. An arrowhead indicates retrogradely labeled CP neurons. The left two panels are MaxIP. Scale bars, 200 μm (left two panels) and 10 μm (rightmost panel). (E) Same as (D), but from the peri-commissural pallium. Arrowheads indicate retrogradely labeled DP neurons. (F) DiI tracing from the cerebellum anterogradely labeled projection fibers in the contralateral DP/CP. An asterisk indicates DiI origin. An inset in the middle panel shows the position of the rightmost panel. The left two panels are MaxIP. Scale bars, 400 μm (left two panels) and 50 μm (rightmost panel). |

scRNA-seq analysis of the zebrafish pallidum identified crhb as a marker of the thalamus-projecting dEN neurons, which also directly project to the pallium (A) An overview of the experimental strategy of the scRNA-seq analysis. (B) Uniform manifold approximation and projection (UMAP) plot displaying the result of clustering. Each dot represents one cell. Clusters are color coded. Only neuronal clusters are shown (n = 2,200 cells in total; see also Figure S5C for the detail). Clusters intrinsic to entopeduncular neurons are circled with the solid red line (EN1–6 clusters). Dashed red and black circles indicate Vd/Vc and pallium clusters, respectively. (C) UMAP plot showing the distribution of the npy-negative and gad1b-positive cells (red dots, n = 235 cells) and the other neurons (gray dots, n = 1,270 cells) in the six EN clusters. The npy-negative and gad1b-positive cells highly accumulated in the EN2 cluster (red circle). (D and E) Expression patterns of the top-five differentially expressed genes of the npy-negative and gad1b-positive cells in the EN2 cluster, determined by a Wilcoxon Rank-Sum test (see method details and Data S1 and S2). Natural log-normalized values of the expression levels are color coded on UMAP of the EN clusters in (D) (n = 1,505 cells). Distributions of mRNA counts from each EN2 neuron are violin plotted in (E) (n = 182 cells). Crhb showed the highest expression among them. (F) WGA tracing from the tac1+ Vd/Vc neurons and trans-synaptic WGA transfer to crhb+ dEN neurons. Immunohistochemistry of AcGFP (green), WGA (yellow), crhb (magenta), and NPY (light blue). Insets show the positions of the next panels, focusing on the dEN. Filled arrowheads indicate crhb-positive and NPY-negative neurons that accumulate WGA as much as that of crhb-negative and NPY-positive neurons (open arrowheads). The leftmost panel is MaxIP. Scale bars, 200 μm (leftmost panel), 50 μm (second panel from left), and 10 μm (right two panels). (G) DiI tracing from the DP/CP in Tg(crhb-hs:GFP) fish retrogradely labeled crhb+ dEN neurons. An inset in the leftmost panel shows the position of the right three panels. Arrowheads indicate retrogradely labeled crhb+ dEN neurons. The leftmost panel is MaxIP. Scale bars, 200 μm (leftmost panel) and 10 μm (right three panels). (H) Same as (G), but from the pallium. DiI solution was used instead of DiI crystal in this experiment (see method details). An asterisk indicates DiI origin. |
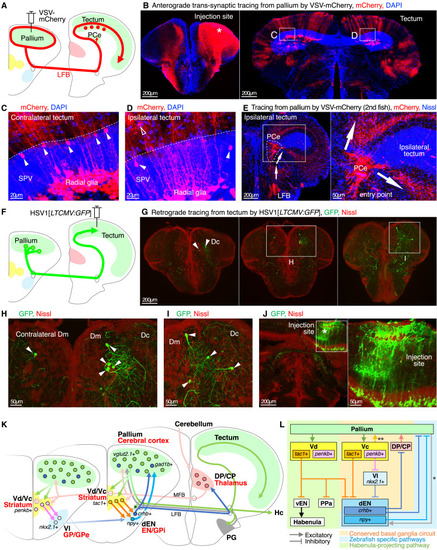
Visualization of output pathways from the pallium to the tectum (A) Illustration of VSV-mCherry injection into the pallium and anterogradely trans-synaptically labeled tectal neurons. (B) VSV-mCherry injection into the pallium and immunohistochemistry of mCherry (red) and DAPI (blue). An asterisk in the left panel indicates an approximate injection point. Insets at the bilateral tectum in the right panel show the positions of (C) and (D). MaxIP is shown. Scale bars, 200 μm. (C and D) Magnified views of the bilateral tectum. Dotted line indicates the boundary between the SPV and the upper layer. Filled arrowheads indicate labeled tectal neurons in the shallower layers of the SPV, and an open arrowhead indicates one outside the SPV. Radial glia were also labeled in the deeper layers of the SPV. Scale bars, 20 μm. (E) VSV-mCherry injection into the pallium of another fish visualized entering pallio-tectal projection fibers from the LFB to the ipsilateral tectum and PCe (arrows). An inset shows the position of the right panel. MaxIP is shown. Scale bars, 200 μm (left panel) and 50 μm (right panel). (F) Illustration of HSV1[LTCMV:GFP] injection into the tectum and retrogradely labeled neurons in the pallium. (G) HSV1[LTCMV:GFP] injection into the tectum and immunohistochemistry of GFP (green) and Nissl (red). Three coronal sections at the telencephalon are shown. Arrowheads indicate retrogradely labeled pallial neurons. Insets show the positions of (H) and (I) (focusing on the pallium). MaxIP is shown. Scale bars, 200 μm. (H and I) Magnified views of the retrogradely labeled pallial neurons in the Dm and Dc (arrowheads). Scale bars, 50 μm. (J) A section at the tectum from the same animal as (G)–(I). An inset at the injection site in the tectum is magnified in the right panel. An asterisk indicates an approximate injection point. MaxIP is shown. Scale bars, 200 μm. (K and L) Schematic diagrams of the zebrafish cortico-basal ganglia-thalamic network elucidated in this study. See also Figure 1D. A pathway marked with asterisk is based on Aoki et al.2 and Lal et al.7 A pathway marked with double asterisk is based on the observation of putative axonal projections and lacks the evidence of synaptic connections with the pallial neurons (see Figures S2A and S2B). |