FIGURE SUMMARY
Title

Comparative transcriptomics coupled to developmental grading via transgenic zebrafish reporter strains identifies conserved features in neutrophil maturation

Authors
Kirchberger, S., Shoeb, M.R., Lazic, D., Wenninger-Weinzierl, A., Fischer, K., Shaw, L.E., Nogueira, F., Rifatbegovic, F., Bozsaky, E., Ladenstein, R., Bodenmiller, B., Lion, T., Traver, D., Farlik, M., Schöfer, C., Taschner-Mandl, S., Halbritter, F., Distel, M.
Source
Full text @ Nat. Commun.

mmp9:Citrine identifies mature neutrophils.

a Confocal images of triple transgenic larvae Tg(lysC:CFP-NTR)vi002/ Tg(BACmmp9:Citrine-CAAX)vi003/ Tg(mpeg:mCherry)gl23 reveal myeloid cells with different expression levels of the three analyzed markers. Stitched whole-mount images of a 5 dpf (days post fertilization) larva. n = 3. b High magnification showing presence of three different cell types: #1 neutrophil: lysC:CFP+mpeg:mCherry+/  mmp9:Citrine+; #2 neutrophil: lysC:CFP+/ mpeg:mCherry-/ mmp9:Citrine-; #3 macrophage: lysC:CFP-mpeg:mCherry+/ mmp9:Citrine-. c Flow cytometric analysis (BD LSRFortessa) of myeloid cells from mpeg:mCherry-lysC:CFP+ control larvae, lysC:CFP-mpeg:mCherry+ controls, or triple transgenic larvae lysC:CFP+/ mmp9:Citrine+/ mpeg:mCherry+(dot plots left to right) at 3 dpf. Histogram and box plot showing expression of mmp9:Citrine in myeloid cells (combined gates of Q1, Q2, Q3; Minimum = 12.4%, Maximum = 17.1%, Median = 15.7%; Box 25th−75th percentile). Violin plots indicating the distribution and expression levels of mmp9:Citrine among myeloid populations (mmp9:Citrine+ gate; n = 5 with pools of 15 triple transgenic larvae each). mfi = mean fluorescence intensity (d) mmp9:Citrine+ neutrophils (red histogram) have a higher side scatter (SSC) and therefore granularity compared to mmp9:Citrine- neutrophils (blue histogram). Flow cytometric analysis of cells isolated from Tg(lysC:CFP-NTR)vi002/ Tg(BACmmp9:Citrine-CAAX)vi003 at 2 dpf. Cells were gated on the lysC:CFP+/ mmp9:Citrine+ or lysC:CFP+/ mmp9:Citrine- populations and analyzed for SSC (n = 3). e Cells were isolated from kidneys, spleen or blood of adult Tg(lysC:dsRed)nz50Tg/ Tg(BACmmp9:Citrine-CAAX)vi003 and analyzed by flow cytometry for frequency of Mmp9+ cells. f Neutrophils were isolated from whole kidney marrow (WKM) of adult Tg(lysC:dsRed)nz50Tg/ Tg(BACmmp9:Citrine-CAAX)vi003 zebrafish and sorted into lysC:dsRed+/ mmp9:Citrine+or lysC:dsRed+/ mmp9:Citrine- populations, cytospins were prepared and Pappenheim stained. Different neutrophil maturation stages were scored blinded, showing that the lysC:dsRed+/ mmp9:Citrine+ population consists of highly differentiated neutrophil stages. INT = intermediate; HI = high. Graph presents average percentages of n = 4 kidneys (721 Mmp9+ cells and 819 Mmp9- cells were analyzed in total). g Representative ultrastructural images show an unsegmented nucleus and round and elongated granules in lysC:CFP+/ mmp9:Citrine- cells (n = 5 from one TEM transmission electron microscopy experiment) contrasting with a segmented nucleus and predominantly elongated granules in lysC:CFP+/ mmp9:CitrineHIcells (n = 2); *, round granules; #, elongated granules.

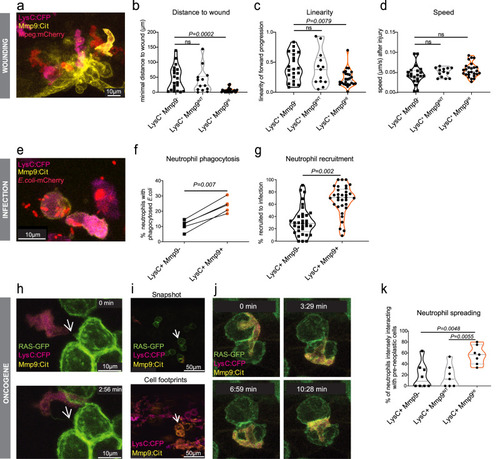
Mmp9+ neutrophils show functions of mature neutrophils.

ad Recruitment of neutrophils to an injury of the fin at 2 dpf (days post fertilization) lysC:CFP+mmp9:CitrineHI, lysC:CFP+mmp9:CitrineINT and lysC:CFP+mmp9:Citrine- neutrophil tracks (n = 21; 13; 26 cells, df = 57, respectively; n = 6 larvae; One-way ANOVA with Dunnett’s test) were analyzed over a 2 h period: b for distance to a wound ROI (P = 0.0002, F = 9.955), (c) linearity of forward progression (mean straight line speed/ track mean speed) (P = 0.0086, F = 5.172) and (d) speed (P = 0.1315, F = 2.103). ns = not significant. INT = intermediate expression; HI = high expression. eg In vivo phagocytosis assays were performed by injecting mCherry-labeled E. coli into the caudal vein or otic vesicle of Tg(lysC:CFP-NTR)vi002/ Tg(BACmmp9:Citrine-CAAX)vi003 zebrafish larvae at 2 dpf. eE. coli were observed inside both, lysC:CFP+mmp9:Citrine+and lysC:CFP+mmp9:Citrine- neutrophils 6 hpi (hours post infection). f Phagocytosis experiments analyzed by flow cytometry (n = 5, each approx. 20 larvae; two-tailed paired t test, P = 0.007; df = 4); g Neutrophil recruitment to E.coli-mCherry injected into the otic vesicle of 3 dpf larvae was analyzed by confocal microscopy (n = 33, two-tailed paired t test, P = 0.002, df = 32). hk Neutrophil- pre-neoplastic cell interactions were observed by confocal microscopy in Et(kita:GAL4)hzm1/ Tg(UAS:EGFP-HRAS_G12V)io006/ Tg(lysC:CFP-NTR)vi002/ Tg(BACmmp9:Citrine-CAAX)vi003 zebrafish larvae starting at 78 hpf. h Still Images of z-stack maximum projections from a time-lapse movie showing Mmp9+ neutrophils forming dynamic contacts with GFP+ kita tumor cells. White arrows point at a GFP+ cell tether. Z-stacks were acquired every 88 s. i Snapshots and cell footprints were taken from the same time-lapse movie (t = 5 h). Superimposition of lysC:CFP and mmp9:Citrine from all time frames generating neutrophil footprints (bottom). White arrow points out how the movements of an Mmp9+ neutrophil copied the outline of the RAS-GFP+ cluster seen in the snapshot (top). j Close-up clippings showing an Mmp9+ neutrophil spreading over the pre-neoplastic cell cluster marked by a white arrow in (i). k Quantification of neutrophil-pre-neoplastic interactions were performed from maximum projections of different time-lapse movies. The frequency of interacting neutrophils of each subpopulation (no, intermediate or high mmp9:Citrine levels) getting into close, intense interactions with GFP+ kita/RAS skin pre-neoplastic cells. (n = 8, one-way ANOVA, P = 0.0022, F = 8.561, df = 19).

scRNA-seq of zebrafish neutrophils reveals a continuous maturation process.

a Schema showing the workflow for cell isolation, multiplexing and scRNA-seq, as well as the bioinformatics analyses applied. NO = no expression; INT = intermediate expression; HI = high expression. WKM = whole kidney marrow. b Uniform Manifold Approximation and Projection (UMAP) of single-cell RNA-seq data (n = 18,150 cells) showing cells from FACS-sorted neutrophil populations (lysC+/ mmp9 = NO, INT, HI) and unsorted whole-kidney marrow cells. The cluster labeled with an asterisk (*) represents a group of cells dominated by cell cycle effects (cp. Supplementary Fig. 3k–m). c, d Reference-based labeling of cell types by projecting cells to two zebrafish hematopoietic reference atlases in the same UMAP as in panel b24,38. As expected, a strong overlap with genetically labeled Tg(mpx:GFP) neutrophils is observed (highlighted in color). e Harmony82 plot of the inferred neutrophil maturation trajectory in zebrafish (n = 15,876 cells). A continuous trajectory indicating a maturation continuum is observed. f Line plots of the distribution of sorted (NO, INT, HI) and unsorted neutrophil populations along the inferred trajectory. g Smoothed expression of lyz and mmp9 in neutrophils along the inferred trajectory.

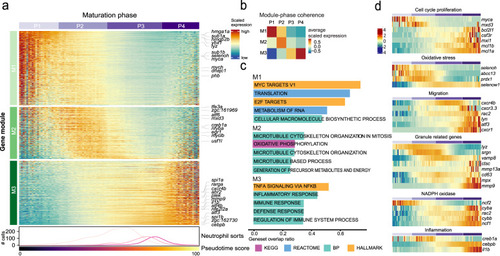
Trajectory analysis uncovers the underlying cell phases and governing gene modules.

a Heatmap showing differentially expressed genes (tradeSeq;40Padj < 0.001, top 1500 based on Wald-statistic) along the maturation trajectory. Cells have been allocated to four distinct phases (P1-P4) and into three distinct gene modules (M1-M3) by hierarchical clustering. The columns of the heatmaps correspond to 100 ordered discrete bins covering the maturation trajectory. The bottom line-annotation shows the distribution of sorted subpopulations along the maturation trajectory (see Fig. 3f) and the bar shows the pseudotime score (see Fig. 3e). b Heatmap summarizing average gene expression per module and phase (from a). c Top-5 enriched gene sets per module from the indicated source pathway databases (hypeR41 over-representation analysis). d Heatmaps of differentially expressed genes (excerpts from a) associated with selected neutrophil-related functional pathways.

Cebpb expression is associated with neutrophil maturation in zebrafish.

a Heatmap showing regulation of selected transcription factors (TFs) during neutrophil maturation. The bottom line-annotation shows the distribution of sorted subpopulations along the maturation trajectory (see Fig. 3f) and the bar shows the pseudotime score (see Fig. 3e). b Ridge plot showing top candidate regulators and their specificity to target genes in each module. Here, “module specificity” measures the similarity of the expression of a TF to all target genes in the neutrophil maturation modules compared to other TFs. It was calculated as 1 minus the dynamic time warping (DTW) distance and scaled relative to all other TFs. Thus, a high score on the x-axis indicates a target gene with a closely matching and specific expression pattern for the TF. The y-axis shows the distribution density for all genes in each module (M1, M2, M3; different colors). c Expression of top TFs ybx1, compared to its putative target genes in module M1 (top), and cebpb, compared to genes in M3 (bottom). d qPCR validation of cebpb expression in sorted lysC:CFP+/ mmp9:Citrine+and lysC:CFP+/ mmp9:Citrine- neutrophils. (n = 3, each sample sorted from a pool of 160 larva; repeated measures ANOVA).

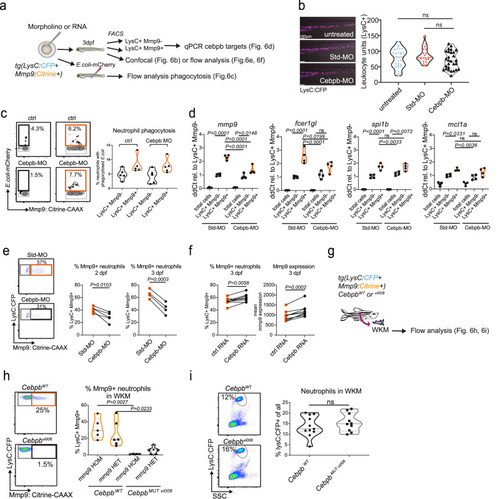
Cebpb regulates aspects of late neutrophil maturation in zebrafish.

ae Analyses of standard (Std)-morpholino (MO) or cebpb-morpholino treated Tg(lysC:CFP-NTR)vi002/ Tg(BACmmp9:Citrine-CAAX)vi003 larvae at 3 dpf (days post-fertilization). a Schematic drawing of subsequent experiments. b ImageJ analysis of LysC+ leukocyte numbers in the tail region of untreated, control (ctrl) standard morpholino or cebpb morpholino-injected larvae (n = 28; 23; 28 larvae, respectively, one-way ANOVA with Tukey´s test, P = 0.1343, F = 2.041, representative image shown to the left). Leica SP8 confocal images with a HC PL APO CS 10x/0.40 DRY; Zoom 0.85x. c In vivo phagocytosis assay with E.coli-mCherry injected into the caudal vein after cebpb morpholino treatment. Representative flow cytometry plots (left). d qPCR of selected target genes of C/ebp-β (selected from Xie et al.14.) in FACS-sorted cells (n = 4; sorted from 65-102 larvae each; one-way ANOVA with Tukey´s test; all P < 0.0001, df = 18) after morpholino treatment at 3 dpf. ns = not significant. e Representative flow cytometry plots show reduction in LysC+Mmp9+ neutrophils after cebpb morpholino treatment (left). Plots summarizing four independent experiments each with pools of approx. 20 larvae per group analyzed by flow cytometry at 2 and 3 dpf after morpholino treatment (right). Two-tailed paired t test. f Frequencies of LysC+Mmp9+ neutrophils and mean mmp9:Citrine expression are increased after cebpb full-length RNA overexpression. Analyzed by flow cytometry 3 dpf after mRNA injection (n = 7; pools of 20 larvae each), two-tailed paired t test. gi Analyses of neutrophils from adult Cebpb mutant fish. WKM = whole kidney marrow. g Schematic drawing. WKM of adult Cebpb wildtype (cebpbWT) or Cebpb mutant (cebpbMUT vi006) Tg(lysC:CFP-NTR)vi002/ Tg(BACmmp9:Citrine-CAAX)vi003 fish was evaluated by flow cytometry. h Representative dot plots (left). Violin plot summarizing percentages of LysC+Mmp9+ neutrophils of all LysC+ neutrophils in mmp9:CitHOM (n = 5) mmp9:CitHET (n = 6) cebpbWT and mmp9:CitHOM (n = 4) mmp9:CitHET (n = 6) cebpbMUT vi006 kidneys. (One-way ANOVA with Tukey´s test P = 0.0006, F = 9.656, df = 17). i Representative dot plots (left). Violin plot summarizing percentages of LysC+ neutrophils of all live cells in cebpbWT (n = 11) and cebpbMUT vi006 (n = 10) kidneys (two-tailed unpaired t test; P = 0.3797).

Alignment of expression trajectories across zebrafish, mouse and human reveals concordant and divergent stages of maturation.

a Heatmap of hierarchically clustered neutrophil maturation stages across studies11,13,4851 based on zebrafish neutrophil maturation signatures (M1ortho, M2ortho, M3ortho). The four aggregated zebrafish phases are highlighted by a dotted box. Column annotations on the top show dataset annotation and row annotations on the left show module membership of each gene. Panels display zebrafish kidney marrow (b), mouse (c) and human (d) bone marrow (BM) scRNA-seq data ordered by their own maturation trajectory10,12,14,5254. Ordered from top to bottom, column annotations display dataset annotations, inferred trajectories per dataset with pseudotime, cell density (histograms) and quality-flagged bins (<= 3 cells; potentially less reliable), heatmaps for modules M1ortho-M3ortho, and author-provided annotations. Left side annotation bars show module membership of each gene orthologue. e, f Average cross-correlation lag between mouse and human datasets (from panels c, d) and the corresponding zebrafish gene.

A pan-species neutrophil maturation signature shows the enrichment of mature neutrophils in BM of metastatic neuroblastoma patients.

a Application of the pan-species neutrophil maturation signatures (M1pan, M2pan, M3pan) derived from maturing zebrafish neutrophils (see Methods for details on signature definition) on bulk RNA sequencing data from 38 bone marrow (NB-BM) samples of patients with metastatic (n = 17, infiltrated) and localized (n = 21, control) neuroblastoma. The heatmap displays the ssGSEA57 score of the maturation signatures on RNA-seq samples from 38 neuroblastoma patients with (n = 17) and without (n = 21) tumor cell bone marrow infiltration. b, c Assessment of neutrophil maturation based on nuclear morphology in BM cytospin samples from patients with metastatic (n = 12, infiltrated) and localized (n = 9, control) neuroblastoma. Samples were stained with DNA-intercalator Iridium and anti-CD15-Bi209, analyzed with IMC and counted blinded. c Analysis of the frequency of segmented neutrophils in control NB-BM (mean = 3.48%; range = 0.8−10.1%) versus infiltrated (mean = 13.48%; range 2−41.3%, two-tailed unpaired t test, P = 0.025).

Model for neutrophil development in zebrafish based on scRNA sequencing.

Association of gene expression with modules and phases as determined by scRNA-seq. Granule stage and morphology were assumed by comparing gene expression (as in Fig. 4d,  7a, Supplementary Data 2) with previously published data for neutrophils. TF = transcription factor; module = M; P = phase; KM = kidney marrow; GMP = granulocyte-monocyte progenitor; MB = myeloblast; PM = promyelocyte; MC = myelocyte; MM = metamyelocyte; BC = band cell; SC = segmented cell.

Acknowledgments
This image is the copyrighted work of the attributed author or publisher, and ZFIN has permission only to display this image to its users. Additional permissions should be obtained from the applicable author or publisher of the image. Full text @ Nat. Commun.