
- Title
-
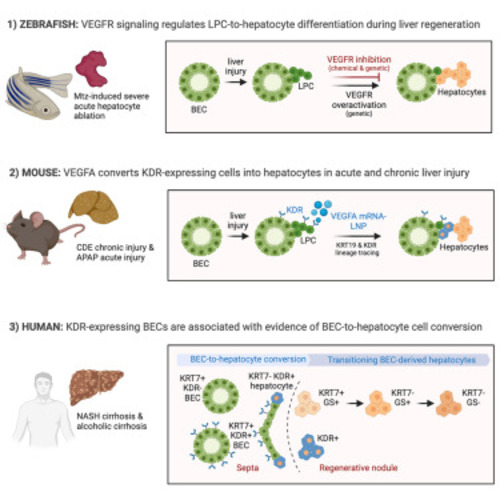
VEGFA mRNA-LNP promotes biliary epithelial cell-to-hepatocyte conversion in acute and chronic liver diseases and reverses steatosis and fibrosis
- Authors
- Rizvi, F., Lee, Y.R., Diaz-Aragon, R., Bawa, P.S., So, J., Florentino, R.M., Wu, S., Sarjoo, A., Truong, E., Smith, A.R., Wang, F., Everton, E., Ostrowska, A., Jung, K., Tam, Y., Muramatsu, H., Pardi, N., Weissman, D., Soto-Gutierrez, A., Shin, D., Gouon-Evans, V.
- Source
- Full text @ Cell Stem Cell
VEGFR signaling regulates BEC-driven liver regeneration in zebrafish (A) Single-optical section images showing the expression of Bhmt (gray), Tp1:H2B-mCherry (red), and fabp10a:CFP-NTR (green) in regenerating livers (dotted lines) at R24h. Scheme illustrates the periods of Mtz and SU5416 treatments and analysis stage. Quantification of the percentage of hepatocytes (Bhmt+) among BEC-derived cells (H2B-mCherry+) and of liver size. (B) Whole-mount in situ hybridization images showing gc and f5 expression (arrows) in regenerating livers at R24h. Numbers in the upper-right corner indicate the proportion of larvae exhibiting the phenotype shown. Based on the levels of hepatic gc and f5 expression, larvae were divided into three groups: no, weak, and strong. (C) Single-optical section images showing the expression of Tp1:H2B-mCherry, fabp10a:CFP-NTR, and Bhmt in regenerating livers (dashed lines) at R26h. To overexpress sFlt1, Tg(hs:sflt1) larvae were heat shocked 4 times at A13h, A24h, A35h, and R10h. Quantification of the percentage of Bhmt+ among BEC-derived cells and of liver size. (D) Maximum projection images showing the expression of hs:loxP-mCherry-loxP and Bhmt in regenerating livers (dashed lines) at R3h. The Tg(Tp1:CreERT2) and Tg(hs:loxP-mCherry-loxP-hVEGFA) lines were used to express hVEGFA in a subset of BEC-derived cells during regeneration. Larvae were treated with 10 μM 4-OHT from 2.5 to 3.5 dpf for 24 h, heat shocked twice at A20h and A34h, and harvested at R3h. Quantification of the percentage of Bhmt+ area in the liver. Data are presented as mean ± SEM. Unpaired two-tailed t test; ∗∗p < 0.01, ∗∗∗p < 0.001, and ∗∗∗∗ p < 0.0001. Scale bars: 50 μm in (A), (C), and (D) and 100 μm in (B). See also Figure S1. |
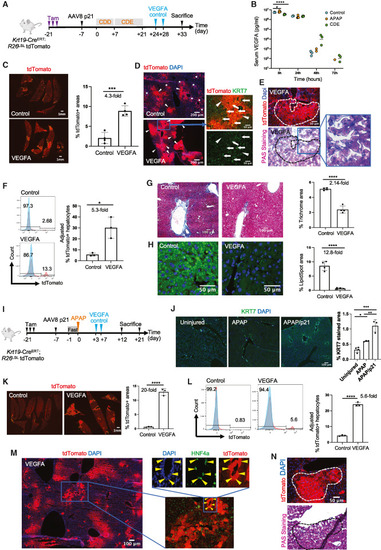
VEGFA mRNA-LNP induces BEC-to-hepatocyte conversion and promotes liver repair in chronic CDE/p21 and acute APAP/p21 liver-injury models in Krt19-CreERT,R26LSLtdTomato mice (A) Schematic depicting CDE/p21 injury model in female mice. (B) Human-specific VEGFA ELISA from sera of uninjured control (n = 3), and mice injured with APAP (n = 4) or CDE (n = 4). (C) Stitched images of tdTomato+ clusters (outlined yellow) in livers from CDE/p21 injured mice. Quantification of tdTomato+ areas in both groups. (D) tdTomato+ (red) and KRT7+ (green) cells in the CDE/p21 model. Closeup images of tdTomato+ hepatocytes (arrowheads) adjacent to tdTomato+KRT7+ BECs (arrows) in VEGFA mRNA-LNP-treated mice. Asterisks represent tdTomato+ BECs. (E) tdTomato and PAS staining of serial sections of liver tissue showing glycogen storage in tdTomato+ hepatocytes in CDE/p21 model. (F) Representative histograms from flow cytometry of hepatocyte fractions from female Krt19-CreERT,R26LSLtdTomato mice treated as shown in Figure 2A. Red histograms represent the percentage of tdTomato+ populations within the hepatocyte fractions. Blue histograms represent hepatocytes from a control non-tdTomato background. Calculation of the percentage of tdTomato+ hepatocytes by extrapolating the lineage-tracing efficiency as 100% across all mice in CDE/p21 model. (G) Brightfield images and quantification of the percentage of trichrome-positive areas from three different fields in each mouse (n = 4 mice per treatment) in CDE/p21 model. (H) Images of LipidSpot staining showing lipids (green) in hepatocytes and quantification of the percentage of LipidSpot-stained areas from three different fields in each mouse (n = 4 mice per treatment) in CDE/p21 model. (I) Schematic depicting APAP/p21 injury model in female mice. (J) Immunofluorescence images and quantification of KRT7+ BECs in APAP or APAP/p21 models 12 days after APAP. (K) Stitched immunofluorescence images of tdTomato+ areas (outlined in yellow) in APAP/p21 model and quantification of tdTomato+ areas. (L) Representative histograms from flow cytometry of hepatocyte fractions isolated 21 days after APAP from male Krt19-CreERT,R26LSLtdTomato mice treated as shown in Figure 2I with 300 mg/kg APAP. Red histograms represent percentage of tdTomato+ populations within the hepatocyte fractions, and blue histograms represent the hepatocytes from a control non-tdTomato background. Calculation of the percentage of tdTomato+ hepatocytes by extrapolating the lineage-tracing efficiency as 100% across all mice. (M) Immunofluorescence images of tdTomato+ hepatocyte (arrows) in APAP/p21 model co-stained with HNF4A (green) 21 days after injury. Closeup images of HNF4A+ cells within a tdTomato+ biliary duct. (N) tdTomato and PAS staining of serial sections of liver demonstrating glycogen storage in tdTomato+ hepatocytes in APAP/p21 model 21 days after injury. Numerical data are presented as mean ± S.D. Two-tailed Student’s t test; ∗p < 0.05, ∗∗p < 0.01, ∗∗∗p < 0.001, ∗∗∗∗p < 0.0001. See also Figures S2 and S3. |
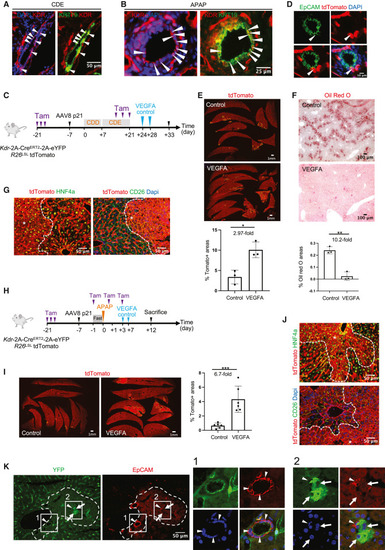
VEGFA mRNA-LNP induces BEC-to-hepatocyte conversion and promotes liver repair in chronic CDE/p21 and acute APAP/p21 liver injury models in Kdr-2A-CreERT2-2A-eYFP mice (A and B) Expression of KDR (red) in BECs (green) depicted by arrowheads 3 days after injury in female mice in CDE/p21 (A) and APAP/p21 (B) models. (C) Schematic depicting the CDE/p21 model. (D) Closeup images of a bile duct showing tdTomato+ EpCAM+ BECs in CDE/p21 injury model. (E) Stitched immunofluorescence images of tdTomato+ areas (outlined yellow) in CDE/p21 injury model. Quantification of the tdTomato+ areas in both groups. (F) Representative brightfield images of Oil Red O-stained liver showing lipids in CDE/p21 injury model. Quantification of the percentage of Oil Red O-stained areas averaged from three different fields in each mouse (n = 3 mice per group). (G) Immunofluorescence images of tdTomato+ hepatocytes co-stained with HNF4A or CD26 (outlined and identified with asterisk) in CDE/p21 injury model. (H) Schematic of the APAP/p21 injury model with 300 mg/kg for males (n = 6) or 500 mg/kg for females (n = 6). (I) Stitched immunofluorescence images of tdTomato+ areas (outlined yellow) and quantification of tdTomato+ areas in APAP/p21 injury model. (J) Immunofluorescence images of tdTomato+ hepatocytes (outlined and identified with asterisk) in APAP/p21 injury model co-stained with HNF4A (green) or CD26 (green). (K) Immunofluorescence images of YFP+ liver cells in Kdr-2A-CreERT2-2A-eYFP mice 3 days after APAP (400 mg/kg for male or 500 mg/kg for female). Closeups show BECs co-expressing YFP (green) and EpCAM (red) (arrowheads) and large intermediate hepatocyte-like cells expressing YFP (green) (arrows). Numerical data are presented as mean ± SD. Two-tailed Student’s t test, ∗p < 0.05, ∗∗p < 0.01, ∗∗∗p < 0.001. See also Figure S4. |

KDR+ BEC fraction after liver injury is molecularly distinct from the KDR− BEC fraction and exhibits VEGF signaling response as well as an epithelial-mesenchymal transition signature (A) Experimental design for scRNA-seq experiment. In total, 2 hepatocyte and 2 NPC fractions were analyzed from 2 mice. (B) UMAP of the scRNA-seq data at the Louvain resolution 0.25. UMAP on the right was obtained after reclustering of cluster 4 (Hep), cluster 13 (BEC2), and cluster 14 (BEC1) from the UMAP on the left. (C) Heatmap of few key genes related to hepatocytes, progenitor/BEC, EMT, and VEGF response in BEC1 and BEC2 clusters. (D) Violin plots for selected genes in BEC1 and BEC2 populations. (E) Violin plots for GO biological process GSEA analysis using differential genes expressed between BEC2 and BEC1 populations. p value calculated with paired t test. See also Figure S5. |
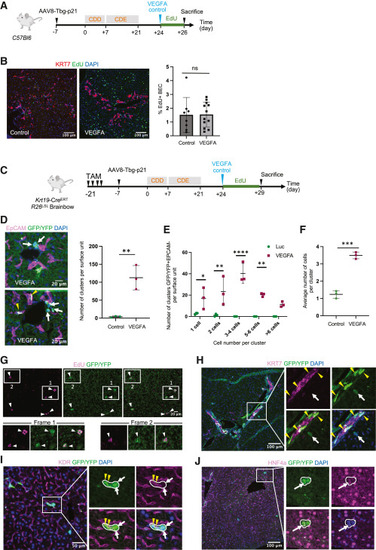
VEGFA mRNA-LNP increases the numbers of BEC-derived progenitor cells in chronically injured mouse livers (A) Schematic of the CDE/p21 injury model for (B). (B) Immunofluorescence images of proliferative EdU+ cells and KRT7+ BECs. Quantification of KRT7+EdU+ BECs using 3 image fields per mice. (C) Schematic of the CDE/p21 injury model for (C)–(H). (D) Immunofluorescence images of GFP/YFP+ cells and EpCAM+ BECs. Quantification of GFP/YFP+EpCAM− clusters in both groups (n = 3 mice per group). All liver lobes in control Luc group were analyzed, while only 2 lobes per mice were analyzed in the VEGFA group. (E) Distribution of GFP/YFP+EpCAM− clusters based on numbers of cells per cluster. (F) Averaged numbers of GFP/YFP+EpCAM− cells per cluster. (G) Immunofluorescence images of proliferative GFP/YFP+EdU+ cells in VEGFA mRNA-LNP-treated mice in CDE/p21 injury model. (H) Immunofluorescence images of GFP/YFP+ cells and KRT7+ BECs. Yellow arrowheads denote GFP/YFP+KRT7+ cells and white arrows GFP/YFP+KRT7− cells. (I) Immunofluorescence images of GFP/YFP+ cells and KDR+ cells. Yellow arrowheads denote GFP/YFP+KDR+ cells and white arrows GFP/YFP+KDR− cells. (J) Immunofluorescence images of GFP/YFP+ cells and HNF4A+ cells. Arrow denotes GFP/YFP+ cells with weak HNF4A staining. Numerical data are presented as mean ± SD. Two-tailed Student’s t test, ∗p < 0.05, ∗∗p < 0.01, ∗∗∗p < 0.001, ∗∗∗∗p < 0.0001. See also Figure S5. |

Evidence of BEC-to-hepatocyte conversion in human liver samples from nonalcoholic steatohepatitis (NASH) cirrhosis and alcoholic cirrhosis ESLD patients (A) Immunofluorescence images of p21 expression in 4 out of 5 human cirrhotic liver specimens. (B) Immunofluorescence images of small cuboidal KRT7+ BECs (arrowheads) and KRT7+ intermediate hepatocyte-like cells (arrows) present in the regenerative nodules (asterisks) close to the fibrous septa (outlined). (C) Immunofluorescence images of KRT7+ and GS+ cells in human cirrhotic specimens. White arrowheads depict GS+KRT7+ BECs. White arrows depict the rare GS+KRT7+ intermediate hepatocyte-like cells and yellow arrows the GS+KRT7− intermediate hepatocyte-like cells. See also Figures S6 and S7. |
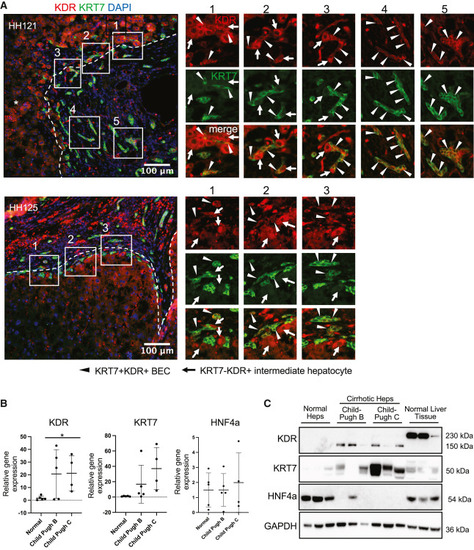
Evidence of KDR expression on BECs in human liver samples from nonalcoholic steatohepatitis (NASH) cirrhosis and alcoholic cirrhosis ESLD patients (A) Immunofluorescence images of cirrhotic liver specimens HH121 and HH125 showing fibrous septa stained for KRT7+ BECs and KDR+ sinusoidal endothelial cells. Note numerous KRT7+KDR+ BECs (arrowheads) and larger KDR+ intermediate hepatocyte-like cells (arrows) surrounding the KRT7+KDR+ BECs. (B) Relative gene expression of KDR, KRT7, and HNF4A in hepatocytes (Heps) isolated from normal (n = 5) or cirrhotic human livers scoring Child-Pugh B (n = 5) and Child-Pugh C (n = 4). (C) Western blots showing protein expression of KDR, KRT7, and HNF4A in hepatocytes isolated from normal or cirrhotic human livers Child-Pugh B (n = 3) and Child-Pugh C (n = 3) analyzed in (B). GAPDH serves as endogenous control. Numerical data are presented as mean ± SD Two-tailed Student’s t test for comparison between two groups; ∗p < 0.05. See also Figure S7. |

|