
- Title
-
Evaluating the association of biallelic OGDHL variants with significant phenotypic heterogeneity
- Authors
- Lin, S.J., Vona, B., Lau, T., Huang, K., Zaki, M.S., Aldeen, H.S., Karimiani, E.G., Rocca, C., Noureldeen, M.M., Saad, A.K., Petree, C., Bartolomaeus, T., Abou Jamra, R., Zifarelli, G., Gotkhindikar, A., Wentzensen, I.M., Liao, M., Cork, E.E., Varshney, P., Hashemi, N., Mohammadi, M.H., Rad, A., Neira, J., Toosi, M.B., Knopp, C., Kurth, I., Challman, T.D., Smith, R., Abdalla, A., Haaf, T., Suri, M., Joshi, M., Chung, W.K., Moreno-De-Luca, A., Houlden, H., Maroofian, R., Varshney, G.K.
- Source
- Full text @ Genome Med.
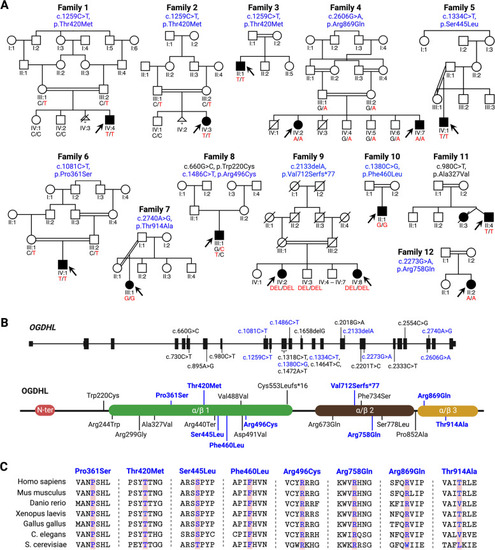
Identification of |
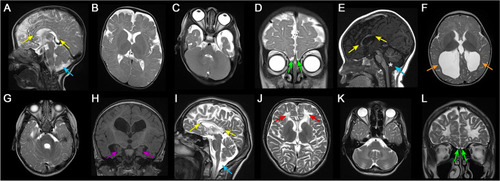
Neuroimaging findings of individuals with |
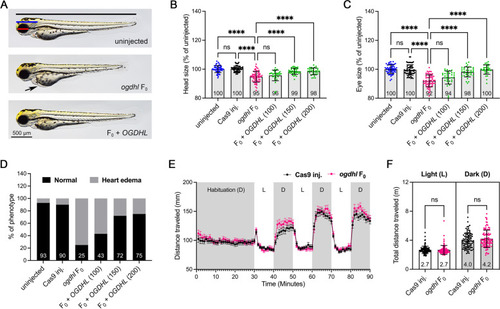
The morphological phenotypes of zebrafish |
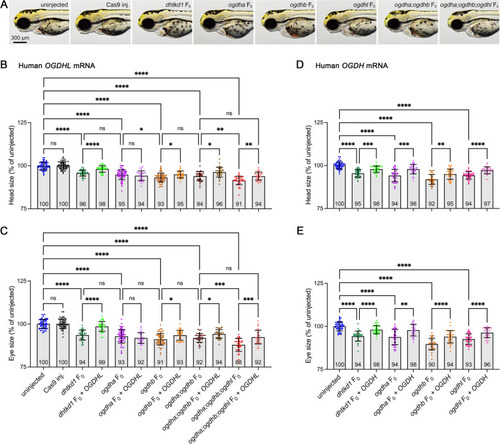
Comparing mRNA rescue levels of OGDHL and OGDH in Dhtkd1 and Ogdh paralog-deficient zebrafish. |
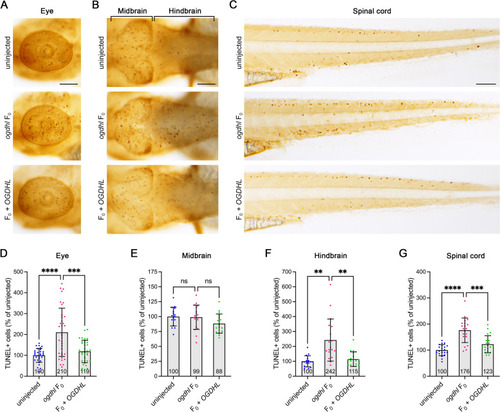
Cell apoptosis was activated by |

Zebrafish |
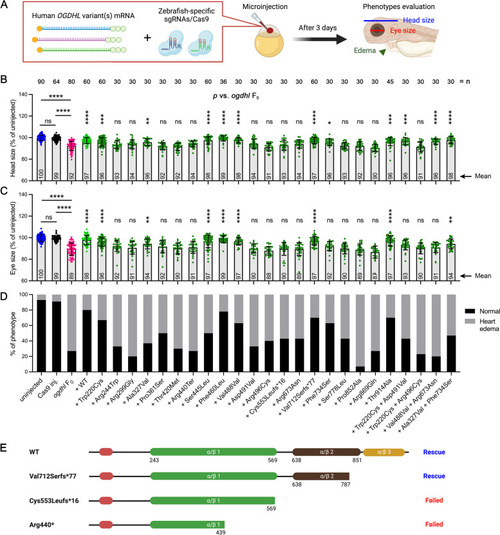
Functional characterization of human |