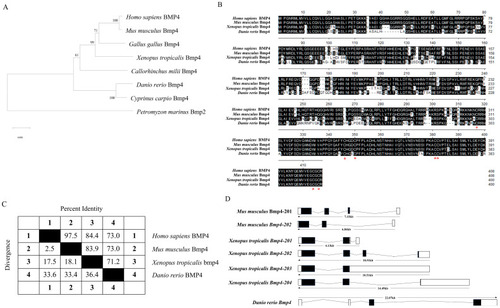
Bioinformatic analysis of D. rerio bmp4. (A) Phylogenetic tree of BMP4 proteins was constructed using MEGA (version 11) using the neighbor-joining method and sea lamprey Bmp2 was rooted as an outgroup. The reliability of each node was estimated by bootstrapping with 1000 replications. The numbers shown at each node indicate the bootstrap values (%). The bars represent the distance. (B) Multiple alignment of zebrafish Bmp4 and other known BMP4 amino acid sequences using the Clustal W program within the MegAlign of the DNASTAR software package (version 7.1). Shaded residues are the amino acids that match the consensus. The red asterisk represents the conserved cysteines. (C) Sequence similarity and sequence divergence of the BMP4 proteins in different species. Numbers in the table are calculated using the method of Clustal W in the software package DNASTAR (version 7.1). (D) Schematic representation of the gene organization comparisons of BMP4 genes in different species. Exons are indicated with boxes and introns are represented as horizontal lines. GenBank accession numbers: Homo sapiens BMP4 (NP_001193.2); Mus musculus Bmp4 (NP_031580.2); Gallus gallus Bmp4 (NP_990568.4); Xenopus tropicalis Bmp4 (NP_001017034.2); Cyprinus carpio Bmp4 (XP_042630442.1); Callorhinchus milii Bmp4 (XP_007886339); and Petromyzon marinus Bmp2 (XP_032811632).

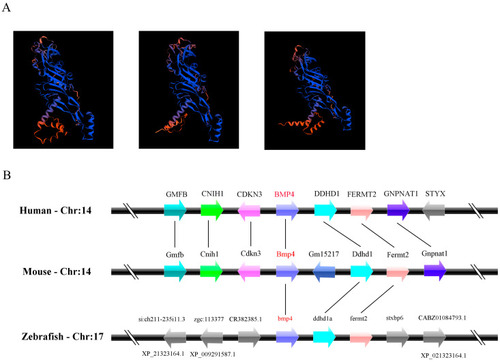
Comparison of the 3-D structure of BMP4 proteins and the loci of
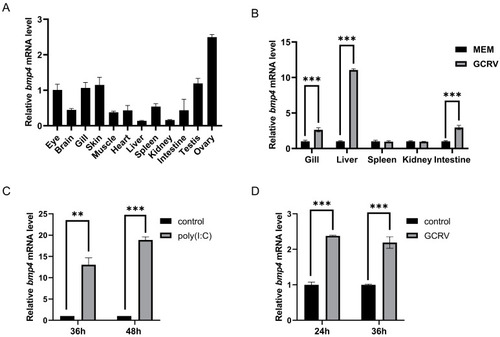
 BMP4 genes in different species. (A) The three-dimensional structures of D. rerio Bmp4, H. sapiens BMP4 and M. musculus Bmp4. This diagram was generated using SWISS-MODEL online software (https://swissmodel.expasy.org/, accessed on 2 July 2023). (B) Synteny map of the genomic segment with BMP4 genes in different species. Genes are represented by boxes. Transcription direction is indicated by arrow.

The bmp4 expression was increased after virus or poly(I:C) challenge. (A) Distribution of bmp4 mRNA in different tissues of adult zebrafish. (B) The expression of bmp4 in the gill, liver, spleen, kidney and intestine from zebrafish challenged with GCRV. Zebrafish injected i.p. with MEM were used as the control. (C,D) Expression of bmp4 mRNA in the ZFL cells challenged with poly(I:C) (C) or GCRV virus (D). ZFL cells challenged with PBS (C) or MEM (D) were used as the control. The expression of actb1 served as an internal control for the qRT-PCR. Data were from three independent experiments and were analyzed through Student’s t-test (two-tailed). All data were presented as mean ± SD (** p < 0.01, *** p < 0.001).

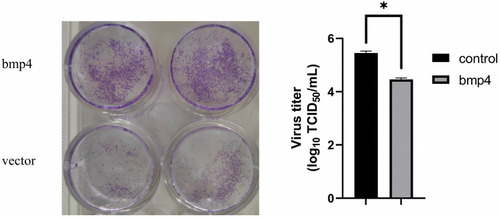
Antiviral function of Bmp4 in vitro. Overexpressing bmp4 significantly decreased the viral titers in EPC cells. EPC cells were transfected with bmp4 or empty vector, and 24 h later, the cells were infected with GCRV (106 TCID50/mL). The cells and culture supernatants were collected 24 h post infection and the viral titers were determined through TCID50 assays. Data were analyzed using Student’s t-test (two-tailed) and are presented as mean ± SD (* p < 0.05).

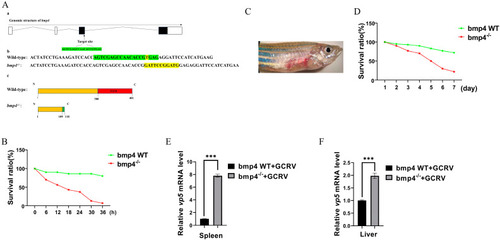
Antiviral function of Bmp4 in vivo. (A) The generation of bmp4 mutation zebrafish using CRISPR/Cas9 technology. a. The knockout gene target is located in exon 3. The black box represents exons. The fold line represents introns. The white square represents un-translated regions. b and c. Compared with the wild type, 1 nucleotide was replaced by 11 nucleotides in exon 3 of bmp4 in the mutant, leading to early termination of translation to the 118th amino acid. (B) Kaplan-Meier ana-ysis of the overall survival of WT (n = 30) or bmp4−/− zebrafish larvae (n = 30), which were infected by adding GCRV into the embryo culture medium (final 6 × 10⁶ TCID50/mL) and monitored every 6 h after infection. (C) The symptoms of adult zebrafish that were infected with the virus of GCRV. (D) Kaplan-Meier analysis of the overall survival of WT (n = 30) or bmp4−/− zebrafish (n = 30) that were injected i.p. with 40 µL of GCRV (2.5 × 10⁷ TCID50/mL) and monitored every day after infection. (E,F) The expression of GCRV RNA in the liver and spleen from wild-type (WT) or bmp4−/− zebrafish injected i.p. with 40 µL of GCRV (2.5 × 10⁷ TCID50/mL). The expression of zebrafish actb1 was used as an internal control for the qRT-PCR. Data were from three independent experiments. Data were analyzed using Student’s t-test (two-tailed) and are presented as mean ± SD (*** p < 0.001).

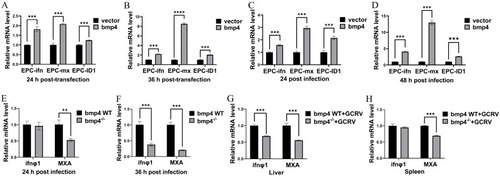
Bmp4 promotes the expression of antiviral genes. (A,B) Expression of EPC ifn and EPC mx mRNA after transfection with bmp4 (2 μg) or empty vector (2 μg) in EPC cells. The cells were collected 24 h or 36 h post transfection. (C,D) Expression of EPC ifn and EPC mx mRNA after transfection with bmp4 (2 μg) or empty vector (2 μg) in EPC cells for 24 h, followed by infection with GCRV for another 24 h or 48 h. (E,F) Expression of ifnφ1 and mxa mRNA from WT or bmp4−/− zebrafish larvae challenged with GCRV for 24 h or 36 h. (G,H) Expression of ifnφ1 and mxa mRNA in the liver and spleen from WT or bmp4−/− adult zebrafish challenged by injecting i.p. with 40 µL of GCRV (2.5 × 10⁷ TCID50/mL) for 36 h. The expression of zebrafish actb1 or EPC actin was used as an internal control for the qRT-PCR. Data were from three independent experiments and were analyzed using Student’s t-test (two-tailed) for comparison of two groups. All data are presented as mean ± SD (** p < 0.01, *** p < 0.001, **** p < 0.0001).

KEGG analysis of the pathways through enrichment of DEGs between bmp4−/− and WT liver tissue of zebrafish challenged by GCRV. Rich factor is the ratio of differentially expressed gene numbers annotated in these pathway terms to all gene numbers annotated in these pathway terms. The q-value means corrected p-value; q < 0.05 is significantly enriched.

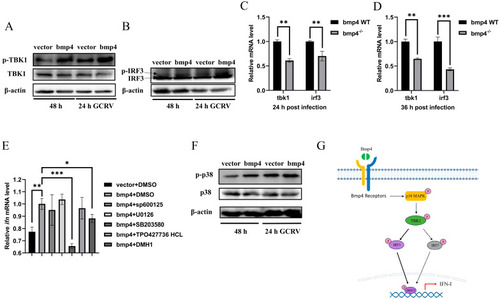
Bmp4 increases Tbk1-Irf3 antiviral signaling via p38 MAPK pathway. (A,B) Immunoblot analysis of phosphorylated (p-) Tbk1 (A) and Irf3 (B) was performed 24 h after transfection of 2 μg of bmp4 or empty vector in EPC cells, followed by infection with or without GCRV for 24 h. (C,D) Expression of tbk1 and irf3 mRNA from WT or bmp4−/− zebrafish larvae challenged with GCRV. (E) Expression of EPC ifn mRNA 24 h after transfection of bmp4 (2 μg) in EPC cells, followed by treatment with SB203580, SP600125, U0126, DMH1 and TP0427736 HCl for 24 h. (F) Representative Western blot analysis in p-p38 MAPK expression in bmp4-overexpressed EPC cells. (G) Schematic illustration of the regulation of Bmp4 in the antiviral immune response. The Bmp4 promotes phosphorylation of Tbk1 and Irf3 to induce the expression of ifn through p38 MAPK pathway. The expression of zebrafish actb1 or EPC actin was used as an internal control for the qRT-PCR. Data were from three independent experiments and were analyzed through Student’s t-test (two-tailed) for comparison of two groups or one-way ANOVA followed by Games-Howell post hoc tests for comparison of multiple groups. All data are presented as mean ± SD (* p < 0.05, ** p < 0.01, *** p < 0.001).

Acknowledgments
This image is the copyrighted work of the attributed author or publisher, and ZFIN has permission only to display this image to its users. Additional permissions should be obtained from the applicable author or publisher of the image. Full text @ Int. J. Mol. Sci.