FIGURE SUMMARY
Title

The Effects of Aging on Rod Bipolar Cell Ribbon Synapses

Authors
Shrestha, A.P., Rameshkumar, N., Boff, J.M., Rajmanna, R., Chandrasegaran, T., Frederick, C.E., Zenisek, D., Vaithianathan, T.
Source
Full text @ Cells

Retinal bipolar cells isolated from old-aged zebrafish exhibited no changes in their brief release properties relative to middle-aged fish. (A,B) Ca2+ current (I) recorded from the synaptic terminal of a bipolar neuron isolated from middle-aged (MA; panel (A)) and older-aged (OA; panel (B)) zebrafish in response to a voltage-clamp pulse (V) from −60 mV to −15 mV for 10 ms. The sinusoidal voltage stimulus used to monitor membrane capacitance (Cm) and series conductance (Gs) is visible at the beginning and end of the voltage trace. Below the traces are the resulting values of Cm for MA (filled circles) vs. OA (open circles) fish and of Gs for MA (filled diamonds) vs. OA (open diamond) fish before and after the activation of the Ca2+ current. (C,D) Average calcium current (C) and capacitance (D) in response to a voltage-clamp pulse (V) from −60 mV to −15 mV for 10 ms that was obtained from bipolar neurons of MA (A) and OA (B) zebrafish. n = 20 MA, seven animals: n = 12 OA bpcs; nine animals. Individual values of Ca2+ current capacitance measurements are shown in Supplementary Figure S2.

The retinal bipolar cells isolated from older-aged zebrafish exhibit changes in the numbers and length of their synaptic ribbons. (A,B) Representative two-dimensional projections of the bipolar cell synaptic terminals from middle-aged (MA; panel (A); n = 19 cells in seven animals) and older-aged (OA; panel (B); n = 19 cells in seven animals) zebrafish in which the synaptic ribbons were labeled by voltage clamping with a whole-cell pipette, whose internal solution contained fluorescent TAMRA-RBP peptides and was visualized by confocal microscopy. Scale bar, 2 µm. (C,D) Imaris-generated three-dimensional (3D)-reconstruction of zebrafish bipolar cells whose synaptic ribbons were labeled with TAMRA-RBP (red) and visualized as described above. Scale bar, 5 µm. (E,F) The average number of ribbons (C) and the ribbon lengths (D) contained by zebrafish bipolar neurons isolated from MA (A) or older-aged (B) zebrafish as described in Section 2.

The morphology of bipolar cell ribbon synapses in the retinal IPL was altered in older-aged zebrafish. (A,B) Transverse retinal sections from middle-aged ((A), left panels; n = 2~4 sections in four retinas from two fish) and old-aged ((B), right panels; n = 2~4 sections in four retinas from two fish) zebrafish were double immunostained with fluorescently labeled antibodies specific for the rod bipolar cell marker PKCα (cyan; top panels) or ribeye a (red; middle panels); also shown is the overlay of PKCα and ribeye a labeling (merge; bottom). Maximal intensity projections are shown, and the relative positions of the INL and IPL are indicated. Scale bar, 20 µm. PKCα, protein kinase C alpha; OPL, outer plexiform layer; INL, inner nuclear layer; IPL, inner plexiform layer. Larger (arrow) and smaller (arrowhead) are indicated in PKCα ribbon terminal morphologies in MA and OA. # Denotes the pear-shaped soma characteristics of Mb1 rod bipolar cells with larger terminals.

The ribbon synapses in the Mb1 bipolar cells from older-aged zebrafish exhibited altered Ca2+ responses after brief depolarization. (A,B) The x-t plots show the Cal520LA fluorescence intensity (green staining in the right section of each plot) at a single ribbon location as a function of time (horizontal axis); RBP-TAMRA fluorescence (red staining in the left section of each plot) indicates the position of the ribbon along the scanned line, while the darker region at the top of each plot is the extracellular space. White arrows indicate the timing of depolarization. (C,D) Spatially averaged Cal520LA fluorescence as a function of time at Mb1 bipolar cell ribbon from middle-aged (MA; panel (C)) or older-aged (OA; panel (D)) zebrafish. Shown is the average intensity (±SEM) in each horizontal row of pixels for three separate 10 ms depolarizations with similar calcium currents (41 ± 4 pA; n = 3 cells; three fish). Fluorescence intensity was normalized by the baseline fluorescence before stimulation by averaging over all pixels (i.e., over space and time) and dividing by the baseline fluorescence (Fmin). The red arrow indicates the onset of the 10 ms depolarizing stimulus.

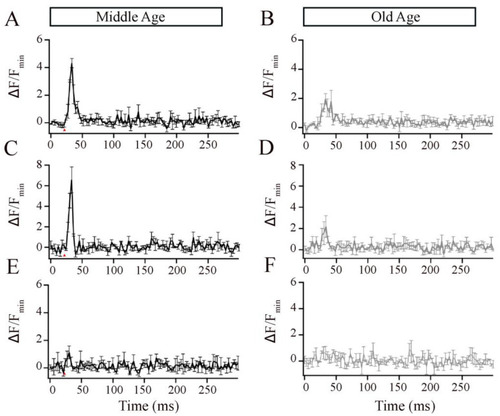
The local Ca2+ responses elicited by brief depolarization at an Mb1 bipolar cell synaptic ribbon were altered in older-aged zebrafish. (A,B) Average Cal520-2LA fluorescence at ribbon locations in response to 10 ms depolarization in Mb1 bipolar cells isolated from middle-aged (MA; left panels; n = 3 ribbons from 3 cells and fish) and older-aged (OA; right panels; n = 3 ribbons from 3 cells and fish) zebrafish with pipette solution containing 2 mM EGTA. Shown is the change in fluorescence (ΔF) from baseline before stimulation, divided by the baseline fluorescence (Fmin). (C,D) Same as in (A,B), except that the pipette solution contained 10 mM EGTA. (E,F) Same as in A-B, except that the pipette solution contained 2 mM BAPTA. Red arrows indicate the time of pulse stimulation.

Acknowledgments
This image is the copyrighted work of the attributed author or publisher, and ZFIN has permission only to display this image to its users. Additional permissions should be obtained from the applicable author or publisher of the image. Full text @ Cells