IMAGE

Figure 2

ID
ZDB-IMAGE-231016-18
Source
Figures for Shrestha et al., 2023
Image
Figure Caption

Figure 2

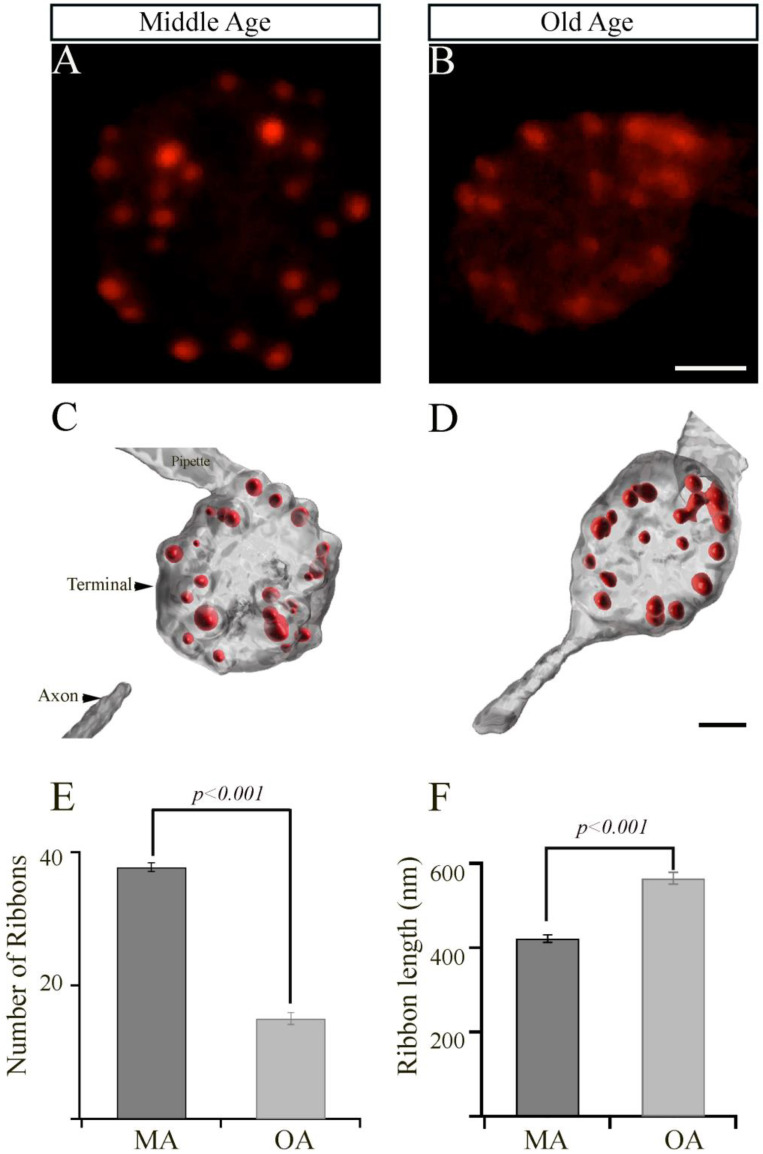
The retinal bipolar cells isolated from older-aged zebrafish exhibit changes in the numbers and length of their synaptic ribbons. (A,B) Representative two-dimensional projections of the bipolar cell synaptic terminals from middle-aged (MA; panel (A); n = 19 cells in seven animals) and older-aged (OA; panel (B); n = 19 cells in seven animals) zebrafish in which the synaptic ribbons were labeled by voltage clamping with a whole-cell pipette, whose internal solution contained fluorescent TAMRA-RBP peptides and was visualized by confocal microscopy. Scale bar, 2 µm. (C,D) Imaris-generated three-dimensional (3D)-reconstruction of zebrafish bipolar cells whose synaptic ribbons were labeled with TAMRA-RBP (red) and visualized as described above. Scale bar, 5 µm. (E,F) The average number of ribbons (C) and the ribbon lengths (D) contained by zebrafish bipolar neurons isolated from MA (A) or older-aged (B) zebrafish as described in Section 2.

Acknowledgments
This image is the copyrighted work of the attributed author or publisher, and ZFIN has permission only to display this image to its users. Additional permissions should be obtained from the applicable author or publisher of the image. Full text @ Cells