
- Title
-
Zinc oxide nanoparticles disrupt development and function of the olfactory sensory system impairing olfaction-mediated behaviour in zebrafish
- Authors
- Takesono, A., Dimitriadou, S., Clark, N.J., Handy, R.D., Mourabit, S., Winter, M.J., Kudoh, T., Tyler, C.R.
- Source
- Full text @ Environ. Int.
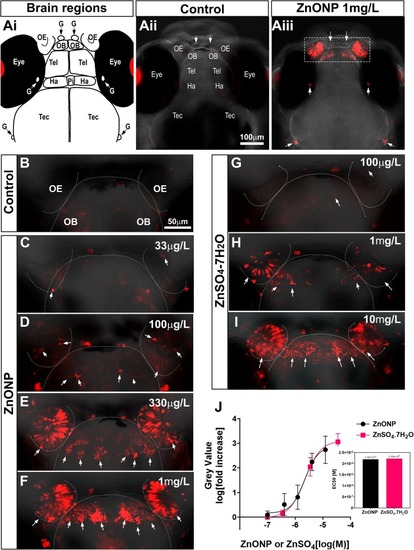
ZnONP exposure specifically induces OS responses in the OE and OB. (Ai) Forebrain -and Midbrain regions in 4 dpf zebrafish embryo-larvae. OE, olfactory epithelium; OB, olfactory bulb; Tel, telencephalon; Ha, habenula; Pi, pineal; Tec, tectum; G, ganglions; Eye. (Aii-iii) Confocal image of control (Aii) and ZnONP (1 mg/L) exposed (Aiii) EpRE:mCherry embryo-larvae. The dotted white square in Aiii, OS responses in the OE and OB; OS responses in ganglions, white arrows. (B-I) ZnONP and dissolved Zn induce a concentration-dependent OS responses in the olfactory tissues. Control (B); ZnONP 33 μg/L (C), 100 μg/L (D), 330 μg/L (E), 1 mg/L (F); ZnSO4·7H2O, 100 μg/L (G), 1 mg/L (H) and 10 mg/L (I). OS responding cells, white arrows; the outlines of the OE and OB, white dotted lines. Scale bar, 50 μm. (J) The dose–response curves of ZnONP (black) and ZnSO4·7H2O (pink) were similar when the molar concentrations were compared. The mean grey values (fluorescent intensity) ± SEM are shown as log [fold increase of grey value] in the OE. EC50 values are shown in the inset bar graph. Non-linear curve fitting was applied to calculate EC50 values using GraphPad Prizm version 9.3.1. Data were derived from five independent experiments for ZnONPs and two independent experiments for ZnSO4·7H2O, with 8 replicates for each condition per experiment. (For interpretation of the references to colour in this figure legend, the reader is referred to the web version of this article.) |

ZnONP exposure induces OS responses in olfactory sensory neurons. (A-D) Confocal images of key limpet haemocyanin (KLH) positive axonal projections of olfactory sensory neurons (OSNs) (green) and mCherry expressing OS responding cells (red) in the OE and OB. The nuclei staining (blue) and white dotted lines, represent the outline of the OE and OB (A-D); olfactory glomeruli, yellow dotted rectangles in A-D; mediodorsal glomeruli, mdGs (Ai-Di); dorsolateral glomerulous, dlG (Aii-Dii); the cell bodies of OS responding OSNs, white arrows (B-D). Scale bar, 25 μm. (E, F) Illustrations of changes in olfactory tissues with (F) or without (E) ZnONP or dissolved Zn exposure to EpRE:mCherry zebrafish embryo-larvae. Control OSNs (green); OS responding OSNs (red); olfactory epitheium, OE; olfactory bulb, OB; Telencephalon, Tel. (For interpretation of the references to colour in this figure legend, the reader is referred to the web version of this article.) |
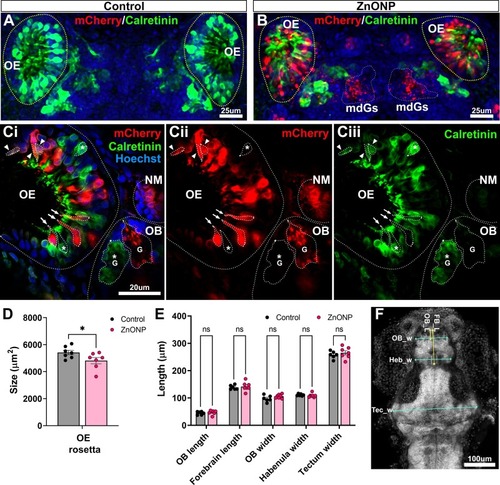
ZnONP exposure primarily triggers OS responses in calretinin-negative OSNs. (A-B) Confocal images of a microvillous OSN marker, calretinin, positive OSNs (green) and mCherry expressing OS responding OSNs (red) in the OE and OB: A, control; B, ZnONP (1 mg/L) exposed EpRE:mCherry embryo-larvae. The outlines of the OE, yellow dotted lines; OS responding OSN projections at mdGs, white dotted lines in B; the nuclei, Hoechst staining (blue). (Ci-Ciii) The optical section image (0.5 μm step size) of OS responding (Cii, mCherry) and calretinin expressing (Ciii, green) OSNs in ZnONP (1 mg/L) exposed EpRE:mCherry embryo-larvae. neuromast, NM; glomerulus, G; mCherry (red) + OSNs, white arrows; calretinin (green) + OSNs, white asterisks; mCherry+/calretinin + double positive OSNs, white arrow heads; the nuclei, Hoechst staining (blue). (D) The measurement of OE rosette area size, and (E) brain region length, n = 7. Mean ± SEM with individual plots shown. (F) The representative positions of the measurements used for E: the lengths, yellow both-end arrows; the widths, cyan both-end arrows. * p < 0.05, by t-test in D; ns (not significant) by ANOVA with Sidak’s post hoc test using GraphPad Prizm version 9.3.1. (For interpretation of the references to colour in this figure legend, the reader is referred to the web version of this article.) |

ZnONP exposure induces a local inflammation in close proximity to OS-responding olfactory tissues. (A) Confocal images of neutrophils (green) and mCherry expressing OS responding OSNs (red) in control (top) or 0.1 mg/L (middle) or 1 mg/L ZnONP (bottom) exposed double transgenic Tg(EpRE:mCherry;mpx:GFP) embryo-larvae. (The left panels) The merged images at the final time point of the time-lapse (20 min), (the middle panels) The trajectories of neutrophils in the anterior-brain region (upper half from the dotted line in the image). The trajectories of individual neutrophils are shown with coloured lines. (The right panels) The trajectories of neutrophils in mid-brain regions (lower half from the dotted line in the image). (Bi-iv and Ci-iv) Dot plots for total neutrophil numbers (Bi and Ci, n = 8–9); total distance (Bii and Cii); displacement (start–end distance) (Biii-Ciii); and speed (Biv-Civ) of neutrophil migration during 20 min timelapse imaging are shown. The above parameters in anterior-brain region (Bi-iv); in mid-head region (Ci-iv) are shown. * p < 0.05, ** p < 0.01, **** p < 0.0001 and ns (not significant) by ANOVA with Tukey’s post hoc test using GraphPad Prizm version 9.3.1. (For interpretation of the references to colour in this figure legend, the reader is referred to the web version of this article.) |
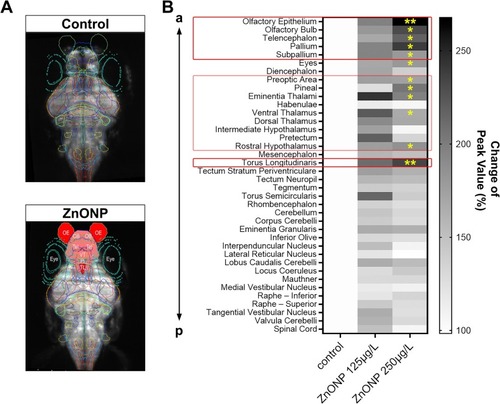
ZnONP exposure alters the intrinsic neuronal activity predominantly in forebrain regions linked with odour processing. (A) LSM images of elavl3:GCaMP6s zebrafish embryo brain (dorsal view) of control (top) and ZnONP (250 μg/L) exposed embryos (bottom) (see details in Methods). Each coloured line in the images represents a brain region of interest (ROI). ROIs whose GCaMP activity is activated by ZnONP are coloured with red gradients (based on the data in Fig. 5B). Olfactory epithelia, OE; olfactory bulb, OB; Telencephalon, Tel; Ventral Tharamus, VT; Pineal, Pi; Torus Longitudinalis, TL. (B) Heat map displaying changes (%) of GCaMP signals in 37 different brain regions. The order of ROIs represents the location of a ROI along the anterior-posterior (a-p) axis (top–bottom). ROIs with a significant increase in the intrinsic neuronal activity are marked with red rectangles. Forebrain regions, I; mid-brain (diencephalon) regions, II; and Torus Longitudinaris, III. * p < 0.05, ** p < 0.01 by mixed effect generalised linear model in R. N = 7–9. (For interpretation of the references to colour in this figure legend, the reader is referred to the web version of this article.) |
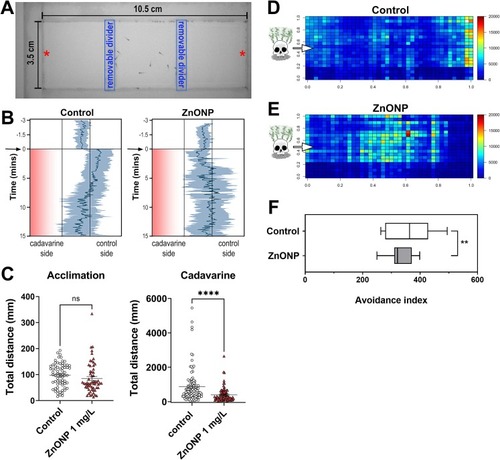
ZnONP exposure impairs olfaction-mediated avoidance behaviour. (A) Illustration of the experimental arena. A fear-related aversive odorant, cadaverine, was administrated at the edge of either side of the arena (red asterisks). (B) Representative data showing the mean (dark grey line) or standard deviation (shading) positions of 10 individuals of control or 1 mg/L ZnONP exposed 5 dpf EpRE:mCherry larvae plotted along the horizontal axis of the experimental arena every two seconds. Cadaverine was applied at time −5 on the left edge and equilibrated for 5 min within the left compartment. The dividers were then removed at time 0 (indicated by arrows) to expose the experimental animals to the cadaverine gradient (red gradient). (C) Dot plots showing total distance travelling during acclimation (left panel) or after the cadavarine exposed period (right panel). Data of total 60–99 fish from 6 to 10 groups are shown. Not significant, ns; p < 0.0001, **** by t-test. (D and E) Colour-coded heat maps indicating the sum of durations for the presence of individual larvae in each square area. The heat maps are plotted from combined data from four independent groups (each 10 fish) of control (top) and ZnONP (1 mg/L)-exposed larvae (bottom). The site of cadavarine administration is indicated with white arrows on the left. (F) The box plots for the means of centroid distance from the site of cadaverine administration over the 10 min acquisition time are shown as “Avoidance index”. Data are from nine groups for each condition including the groups with cadaverine administration at either left or right site. ** p < 0.01 with mixed effect generalised linear model in R. (For interpretation of the references to colour in this figure legend, the reader is referred to the web version of this article.) |

|