
- Title
-
Dermomyotome-derived endothelial cells migrate to the dorsal aorta to support hematopoietic stem cell emergence
- Authors
- Sahai-Hernandez, P., Pouget, C., Eyal, S., Svoboda, O., Chacon, J., Grimm, L., Gjøen, T., Traver, D.
- Source
- Full text @ Elife

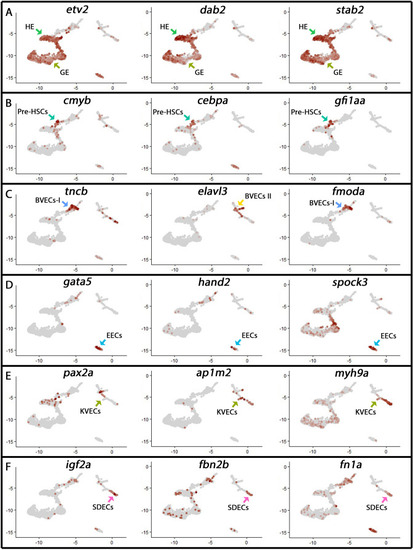
Cell-type-specific endothelial cell markers highlight cellular diversity within the vasculature. (A) Uniform manifold approximation projection (UMAP) plots of scRNA-seq data of total endothelial lineage cells collected from TgBAC(etv2:Kaede)ci6, Tg(fli1:DsRed)um13; Tg(tp1:GFP)um14, and Tg(drl:H2B-dendra) embryos at 22–24 hpf. Clusters were named according to their gene expression: Erythroid, Lymphoid, General Endothelium (GE), Hemogenic Endothelium (HE), Pre-HSCs, Brain Vascular Endothelial Cells (BVECs-I and BVECs-II), Kidney Vascular Endothelial cells (KVECs), Endocardial Endothelial Cells (EECs), and somite-derived endothelial cells (SDECs). Color-coded marker gene expression levels are shown on corresponding clusters. A pink circle highlights the SDEC cluster. (B) Expression heatmap of 22–24 hpf single-cell transcriptome shows the top predicted differentially expressed marker genes across the different clusters. A red box highlights the SDEC cluster. (C’,C”) A list of somite-annotated genes was curated from the AmiGo annotation database and compared with the SDEC transcriptome. 32 genes were commonly expressed. Interestingly, several of these 32 genes were enriched within the SDEC cluster (C”; white boxed genes, D; enlarged circles). |
Cluster identity was assigned based on known marker genes. ( |
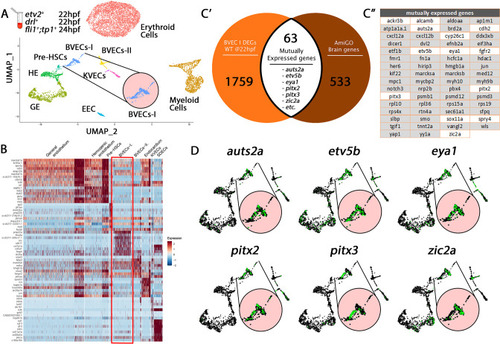
Comparison of BVECs-I cluster genes to brain annotated genes validates cluster origin. ( |
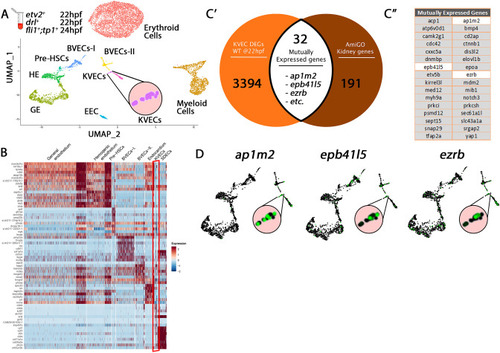
Comparison of KVEC Cluster genes to kidney annotated genes validates cluster origin. ( |
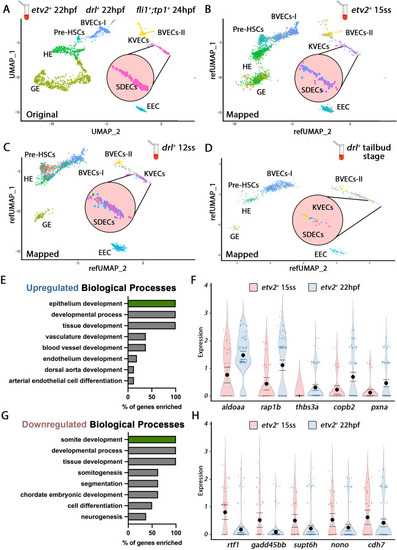
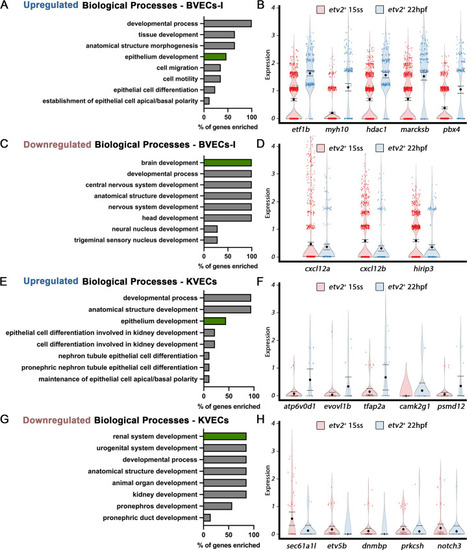
Cellular diversity within the vasculature can be traced back to the tailbud stage. (A) Uniform manifold approximation projection (UMAP) plots of scRNA-seq data of total endothelial lineage cells collected from TgBAC(etv2:Kaede)ci6, Tg(fli1:DsRed)um13; Tg(tp1:GFP)um14, and Tg(drl:H2B-dendra) embryos at 22–24 hpf. Clusters were named according to their gene expression: General Endothelium (GE), Hemogenic Endothelium (HE), Pre-HSCs, Brain Vascular Endothelial Cells (BVECs-I and BVECs-II), Kidney Vascular Endothelial cells (KVECs), Endocardial Endothelial Cells (EEC), and somite-derived endothelial cells (SDECs). Color-coded marker gene expression levels are shown on corresponding clusters. A pink circle highlights the SDEC cluster. (B–D) Referenced uniform manifold approximation projection (RefUMAP) plots of scRNA-seq data of total endothelial lineage cells collected from etv2:Kaede+ embryos at 15 ss (B) and drl:H2B-dendra+ embryos at 12 ss (C) and tailbud stage (D). By cross-referencing the transcriptomes of EC subsets at each developmental stage to the 22–24 hpf ECs, we identified EC clusters with distinct transcriptomes as early as the tailbud stage. (E–H) Comparison of expression patterns of EC populations from early TgBAC(etv2:Kaede)ci6 15 ss, and later 22 hpf etv2:Kaede+ in the 32 overlapping genes between the SDEC transcriptome data and the AmiGo somite annotated genes. (E,F) Representative genes that were upregulated in the etv2:Kaede+ 22 hpf samples compared to the 15 ss sample (F) and their suggested role in EC differentiation, according to GO biological processes (E). (G,H) Representative genes that were downregulated in the etv2:Kaede+ 22 hpf samples compared to the 15 ss sample (H) and their suggested role in somitogenesis, according to GO biological processes (G). The expression and downregulation of somitic genes within etv2+ ECs between 15 ss and 22 hpf highlight their somitic origin and loss of myogenic cell fate. |
Differentially expressed genes between early and late ECs in BVECs-I or KVECs clusters highlight an early commitment to EC fate. ( |
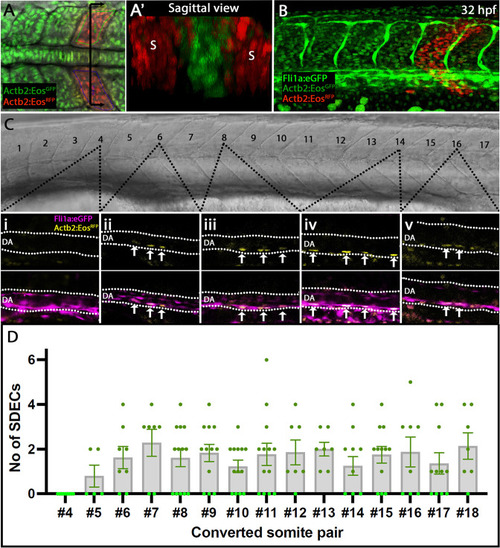
Rare SDECs emerge from trunk somites and migrate to the dorsal aorta. ( |

Endothelial cells emerge from the dermomyotome at 12 ss. (A–E) Time-lapse imaging from a dorsal view of Tg(etv2.1:EGFP)zf372 embryos injected with mOrange:CAAX mRNA and imaged between 10 ss and 15 ss. (A) The expression of Etv2:GFP+ cells is visible along the LPM region (arrow) at 10 ss. At this stage, no Etv2:GFP+ cells are visible in the somites. (B) Starting at 12 ss, the first Etv2:GFP+ SDECs are detected in the lateral lip of the dermomyotome (arrowheads). Simultaneously, the LPM Etv2:GFP+ cells start migrating to the midline. (C) Soon after emergence, SDECs change shape and become rounder (arrowheads). (D–E) Etv2:GFP+ SDECs bud off from the somite as individual cells (arrowhead). (F) Dorsal view of a 12 ss embryo that was submitted to double fluorescent in situ hybridization for muscle progenitor maker pax3a (green) and endothelial marker etv2 (red). pax3a expression reveals the dermomyotome compartment that contains muscle progenitor cells. An etv2+ SDEC (red and arrowhead) is found in the dermomyotome, co-expressing pax3a (green), showing colocalization of an endothelial and muscle progenitor cell marker. We observed 1–2 etv2-positive cells per somite in each of the embryos examined (n=6). (G) Somitic etv2+ SDECs (green) do not co-express the muscle differentiation marker myoD (red), suggesting that etv2 expression is restricted to the muscle progenitor region of the somite. Dashed white lines delimitate somite from the LPM (arrow). We observed 1–2 etv2-positive cells per somite in each of the embryos examined (n=6). s, somites; LPM, lateral plate mesoderm; SDECs, somite-derived endothelial cells. |

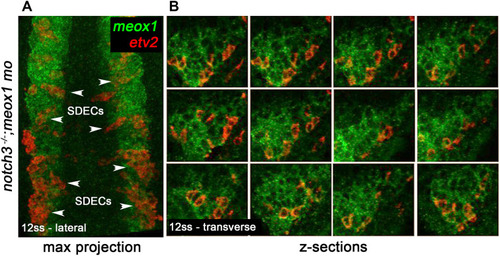
notch is required for the maintenance of a bipotent skeletal muscle progenitor population in the somite. (A–F) Dorsal view of 12 ss control (A–C) and meox1 morphant embryos (D–F). Embryos were submitted to double fluorescent in situ hybridization for meox1 (green) and etv2 (red). In control and morphant embryos, meox1; etv2 double-positive cells are detected within the somite compartment (arrowheads). (C,F) Overlay of meox1 (green), etv2 (red), and DAPI (blue). (D–F) Knockdown of meox1 results in ectopic formation of double-positive cells within the somite (arrowheads). We observed 3–4 etv2 positive cells per somite in the meox1 morphants compared to 1–2 etv2-positive cells per somite in the siblings (n=3). (G–H) Time-lapse imaging of a 22 hpf Tg(etv2.1:eGFP)zf372; Tg(phldb1:mCherry) embryo, injected with meox1 morpholino and mOrange2:CAAX mRNA to delineate cell boundaries. Knockdown of meox1 results in an extension of the period that the dermomyotome can generate Etv2:GFP+ cells (arrowheads). (I–K) Cross section of 12 ss Tg(etv2.1:eGFP)zf372 embryo. In absence of meox1 (J), ectopic Etv2:GFP+ cells are visible in epithelialized layer of the somites, compared to controls (I). In embryos coinjected with mib and meox1 morpholinos, the number of Etv2:GFP+ cells within the somite compartment (dotted line) is substantially increased (arrowheads) (K), suggesting that Notch signaling is dispensable for SDEC specification. (L–N) Lateral view of 12 ss embryos analyzed by FISH for meox1 (green), etv2 (red), and DAPI (blue). In notch3+/- heterozygote controls (L) and notch3-/- mutant embryos (M), etv2+ SDECs are detected in the somites. (N) notch3-/- mutant embryos co-injected with meox1 morpholino results in ectopic formation of etv2; meox1 double positive cells (arrowheads). We observed 2–4 etv2-positive cells per somite in the notch3 mutants and >6 etv2-positive cells in the notch3 mutants; Mib morphants (n=3). (O) qRT-PCR in 24 hpf notch3-/- mutant embryos and sibling controls. Genetic ablation of notch3 results in decreased expression of muscle progenitor markers pax3a and pax7b; increased expression of muscle differentiation genes, myod and myog, and endothelial markers, etv2, and fli1. Asterisks denote a statistically significant difference (p<0.05, unpaired, two-tailed Student’s t-test; n=3.) (P,Q) notch3-/- mutant embryos show premature expression of MyoHII in 48 hpf embryos (Q) compared to sibling controls (P). (R) Summary cartoon for the role of Notch signaling in the maintenance of bipotent-muscle progenitors (bipotent muscle progenitors in purple and green; muscle cells in green; SDECs in purple). s, somites; LPM, lateral plate mesoderm; SDECs, somite-derived endothelial cells. |
Bipotent muscle progenitor cells contain endothelial potential that can reach the dermomyotome compartment. ( |

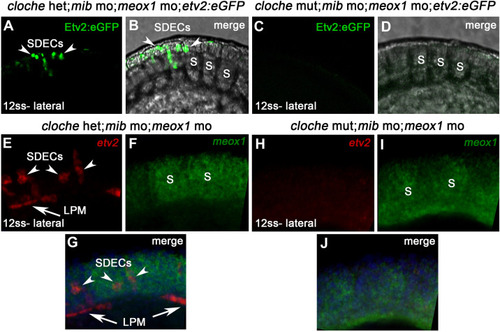
npas4l is required for the specification of SDECs. (A–D) WISH for etv2 in 12 ss npas4l-/- (cloche) mutant and control embryos. (B) cloche mutant embryos show an absence of etv2 expression along the A-P axis of the embryo, compared to sibling control (A). (D) Similarly, cloche mutant embryos injected with meox1 morpholino show loss of etv2 expression, compared to sibling control (C). (E) qRT-PCR of cloche mutant embryos shows expected loss of endothelial genes (fli1 and etv2) and concomitant increase of muscle differentiation genes (myod and myog), compared to sibling control. All genes analyzed between cloche mutant and cloche het embryos showed a statistically significant difference (p<0.001, unpaired, two-tailed Student’s t-test; n=3.) (F, G) Summary cartoon for the effect of npas4l on endothelial cell competence in PM progenitors (early mesoderm progenitor in grey; bipotent muscle progenitor in purple and green; muscle cells in green; endothelial cells in purple). LPM, lateral plate mesoderm; SDECs, somite-derived endothelial cells. |
( |
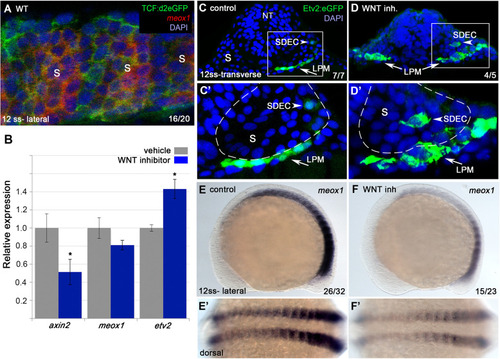
Wnt signaling is required for the regionalization of SDECs. ( |
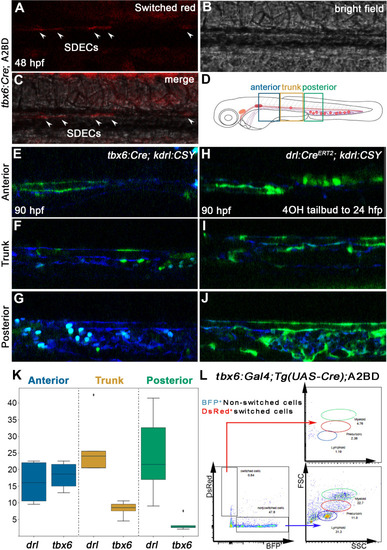
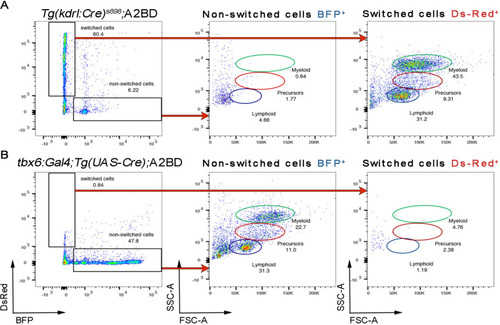
SDECs contribute to the dorsal aorta but do not generate HSPCs. (A–C) Lineage tracing of SDECs using tbx6:Gal4; Tg(UAS-Cre); A2BD shows dsRed+ cells in the vasculature region at 48 hpf (arrowheads). (E–J) Using a vasculature-specific switch line TgBACkdrl:LOXP-AmCyan-LOXP-ZsYellow (referred to as kdrl:CSY), we observe the contribution of SDECs or LPM-derived endothelial cells to the vasculature. (E–G) For SDEC labeling, a PM-specific driver tbx6:Gal4; Tg(UAS-Cre) was used. PM-derived YFP+ SDECs are observed in the vasculature of imaged embryos. (H–J) For LPM-specific EC labeling, a Tg(drl:CreERT2) was used and treated with 10 µm tamoxifen starting at 8 hpf. YFP+ ECs are observed in all regions of the vasculature. (K) Quantification of YFP+ SDECs and ECs from tbx6 or drl switched embryos, respectively. Quantifications were based on independent experiments per transgenic background with n=23 for tbx6 switched embryos and n=9 for drl switch embryos. (L) Analysis of the adult kidney marrow of tbx6:Gal4; Tg(UAS-Cre); A2BD animals shows no contribution to hematopoietic cells from switched DsRed+ SDECs through flow cytometry analysis, whereas the FSC/SSC distribution of the unswitched BFP+ ECs corresponds to all blood lineages (quantifications based from independent experiments with a total of n=21 samples). SDECs, somite-derived endothelial cells. |
Paraxial mesoderm does not generate HSPCs. ( |

SDECs act as a vascular niche for hemogenic endothelium. ( |