
- Title
-
Assessment of various standard fish diets on gut microbiome of platyfish Xiphophorus maculatus
- Authors
- Soria, E., Russo, C., Carlos-Shanley, C., Drewery, M., Boswell, W., Savage, M., Sanchez, L., Chang, C., Varga, Z.M., Kent, M.L., Sharpton, T.J., Lu, Y.
- Source
- Full text @ J. Exp. Zool. B Mol. Dev. Evol.
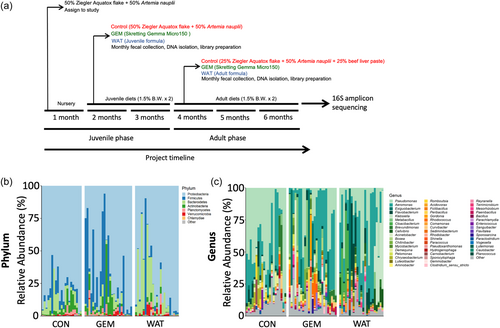
Relative abundance of bacterial phyla and genera in fecal samples of Xiphophorus on different feeding regimes. (a) Experiment design and sample collection timeline is displayed. Relative abundance plots were generated at (b) phylum and (c) genus level and grouped by feeding regime. Size of stacked bar represents relative compositions of taxonomy. |
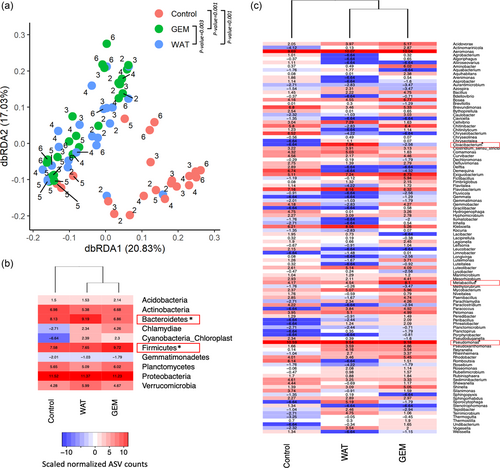
Beta diversity of bacterial amplicon sequence variants (ASV) in fecal samples of Xiphophorus between different feeding regimes. (a) The dbRDA plot was based on Bray–Curtis dissimilarity. Different colors indicate dietary treatment and numbers indicate age in months. permutational multivariate analysis of variance (PERMANOV) results for interfeeding regime comparisons are shown as p-values per comparison group. All p-values were corrected for multiple comparisons using Benjamini–Hochberg. Heatmaps show Xiphophorus fecal bacterial (b) phyla and (c) genera that were affected by feeding regime. Color and number of each heatmap tile represent scaled normalized ASV counts. Bacterial phylum and genus that were differentially enriched in gut microbiome of different feeding regimes were determined using false discovery rate (FDR) <0.05 and linear discriminant analysis (LDA) ≥2.0, and are highlighted using red text box. |