
- Title
-
Lack of Stim2 Affects Vision-Dependent Behavior and Sensitivity to Hypoxia
- Authors
- Wasilewska, I., Majewski, Ł., Adamek-Urbańska, D., Mondal, S.S., Baranykova, S., Gupta, R.K., Bielecki, D., Winata, C.L., Kuznicki, J.
- Source
- Full text @ Zebrafish

Characterization of (stim2a;stim2b)−/− zebrafish line. (A) The phenotype of 18-month-old (stim2a;stim2b)−/− fish was indistinguishable from (stim2a;stim2b)+/+ fish. Length of fish was measured from the nose to the base of the tail, n = 4 (stim2a;stim2b)+/+ females, n = 11 (stim2a;stim2b)+/+ males, n = 7 (stim2a;stim2b)−/− females, and n = 4 (stim2a;stim2b)−/− males. (B) mRNA levels of genes associated with the SOCE response in (stim2a;stim2b)−/− zebrafish relative to (stim2a;stim2b)+/+ zebrafish. The data are expressed as the mean ± SEM of n = 3 samples/group. *p < 0.05. (C) Histopathological changes in the corpuscles of Stannius (marked with arrows) with observed changes in AB/PAS affinity (AB/PAS staining) and (D) alterations of the retinal pigment epithelium in (stim2a;stim2b)−/− fish (HE staining). (E) Width of retina layers in adult (stim2a;stim2b)+/+ and (stim2a;stim2b)−/− zebrafish, n = 12 (stim2a;stim2b)+/+ and n = 13 (stim2a;stim2b)−/−. AB, Alcian blue; GCL, ganglion cell layer; HE, hematoxylin and eosin; INL, inner nuclear layer; IPL, inner plexiform layer; ONL, outer nuclear layer; OPL, outer plexiform layer; PAS, Periodic Acid-Schiff; PL, photoreceptors layer; RPE, retinal pigmented epithelium; SOCE, store-operated calcium entry. |

Differential gene expression established by RNA-sequencing analysis. (A) Principal component analysis of gene expression data (transcripts per kilobase million) from all six replicates of the two genotypes. (B) Volcano plot of transcriptional differences between (stim2a;stim2b)−/− and (stim2a;stim2b)+/+ 5 dpf larvae presenting genes with the highest fold change with an increase in annexin A3a expression (encircled in black). Logarithms (base 2) of fold changes in individual genes (x-axis) are plotted against negative logarithms (base 10) of their adjusted p-values (y-axis). Positive log2 (fold change) values represent upregulation in (stim2a;stim2b)−/− mutant larvae compared with (stim2a;stim2b)+/+ larvae, and negative log2 (fold change) values represent downregulation. Points above the dotted line parallel to the x-axis represent differentially expressed genes in (stim2a;stim2b)−/− mutants with p < 0.05 after correction for multiple testing. (C) Selected terms from functional enrichment analysis, which were significantly enriched in significantly downregulated genes (adjusted p < 0.05), are shown. The color of the bar represents adjusted p-values (red to blue, with dark red being close to 0 and dark blue being close to 0.05). The length of the bar represents the ratio of the number of genes in the term, which were significantly downregulated (intersection size), and total number of genes in the term (term size). The term “sensory perception of light stimulus” is marked within a black rectangle. (D) Volcano plot from (B) with focus on the data-rich section. Downregulated genes that are related to the sensory perception of light stimuli in (stim2a;stim2b)−/− larvae are marked on the volcano plot (in black). Genes associated with inflammasome activation are marked in purple. (E, F) Increase in the number of Neutral Red-positive cells, likely microglia, in (stim2a;stim2b)−/− fish, imaged in vivo in the brain. Arrows (E) indicate the Neutral Red-positive cells. Analysis was carried out on 15 larvae of (stim2a;stim2b)+/+ and 13 of (stim2a;stim2b)−/−. The experiments were carried out in triplicate. ***p < 0.001. |

Effect of hypoxia on survival, cell death, and gene expression in (stim2a;stim2b)+/+ and (stim2a;stim2b)−/− larvae. (A) The survival rate is expressed as the mean ± SEM of n ≥ 180 larvae per group. (B) On the left upper panel, there are representative images of AO staining and the lower panel presents AO-positive cells in the OT in (stim2a;stim2b)+/+ and (stim2a;stim2b)−/− larvae. The right panel shows its quantification, n = 18 larvae per group. (C) Expression of selected genes that are related to cell death pathways and (D) microglia-associated genes, estimated by qPCR, in (stim2a;stim2b)+/+ and (stim2a;stim2b)−/− larvae. The data are expressed as the mean ± SEM of n = 3–6 samples/group. *p < 0.05, **p < 0.01, ***p < 0.001. AO, Acridine Orange; OT, optic tectum; qPCR, quantitative polymerase chain reaction. |
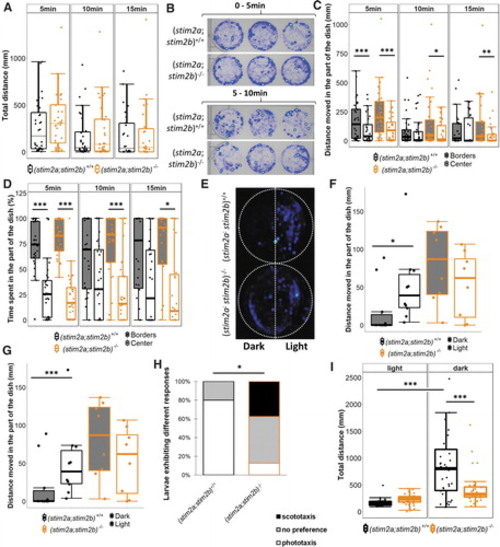
Mobility and thigmotaxis in (stim2a;stim2b)+/+ and (stim2a;stim2b)−/− 4 dpf larvae in the open-field test. (A) Total distance travelled and (B) mean heat maps of traces of larvae in both groups, divided into 5-min periods. (C) Distance travelled and (D) proportion of time spent in parts of well. n = 32 (stim2a;stim2b)+/+ larvae and n = 33 (stim2a;stim2b)−/− larvae. The Wilcoxon rank sum test was used to compare mutant and (stim2a;stim2b)+/+ fish. The paired t-test was used to compare borders and the center. (E–H) Behavior of (stim2a;stim2b)+/+ and (stim2a;stim2b)−/− 4 dpf larvae in the dark-light preference test. (E) Mean heat maps of traces of (stim2a;stim2b)+/+ and mutant larvae. (F) Total distance covered and (G) proportion of time spent in parts of the dish in larvae from both groups. (H) Proportion of larvae that exhibited phototaxis (>70% of time spent in the light), scototaxis (<30% of time spent in the light), or no preference. n = 10 (stim2a;stim2b)+/+ larvae, n = 8 (stim2a;stim2b)−/− larvae. The Wilcoxon rank sum test was used to compare mutant and (stim2a;stim2b)+/+ fish. The paired t-test was used to compare borders and the center. The response distribution was compared using theχ2 test. (I) Visual-motor response test. Total distance covered during the 10-min period after switching the light on (light) and during subsequent 10-min period after switching the light off (dark). n = 36 (stim2a;stim2b)+/+ larvae, n = 36 (stim2a;stim2b)−/− larvae. The effects of light condition and genotype on mobility were compared using two-way analysis of variance followed by the Tukey Honestly Significant Difference post hoc test. *p < 0.05, **p < 0.01, ***p < 0.001. dpf, days |