
- Title
-
The RNA-binding protein Adad1 is necessary for germ cell maintenance and meiosis in zebrafish
- Authors
- Islam, K.N., Ajao, A., Venkataramani, K., Rivera, J., Pathania, S., Henke, K., Siegfried, K.R.
- Source
- Full text @ PLoS Genet.
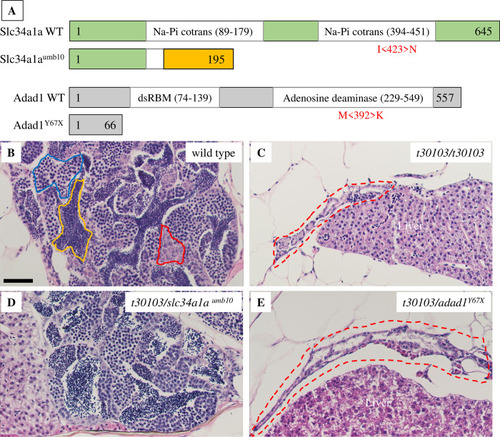
Mutations disrupting the A: Graphical representation of Slc34a1a and Adad1 wild-type and mutant proteins. Missense mutations are shown in red below wild-type protein schematics in the approximate position they occur in the protein. Representative images of truncated proteins resulting from nonsense mutations are shown. The frameshifted region of PHENOTYPE:
|
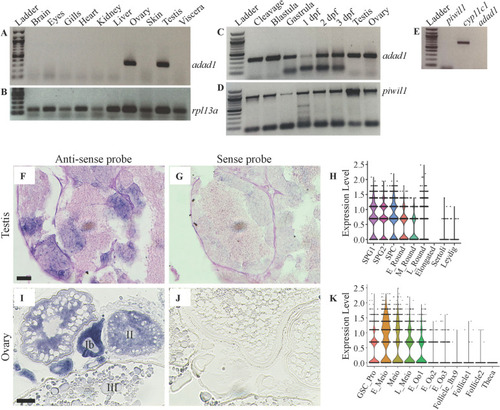
A-D: RT-PCR assaying |
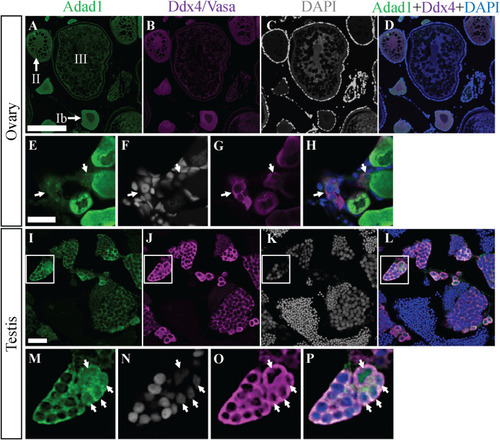
Adad1 protein expression in adult ovaries and testes. A-H: In the ovary, Adad1 is expressed in the cytoplasm of prefollicle stages through stage II oocytes (A and E) similar to the Ddx4/Vasa protein (B and G). Similar levels of Adad1 were seen in nuclei and cytoplasm of pre-follicle stage germ cells (E-H, arrows). Images in panels A-D and E-H are from different samples I-L: In the testis, Adad1is expressed in the cytoplasm of spermatogonia and spermatocytes but not in mature sperm (I), overlapping with Ddx4/Vasa expression (J). Magnification of the insets shows that Adad1 is both nuclear and cytoplasmic in single spermatogonia and spermatogonia in cysts of 2–4 cells (M-P, arrows). Scale bars: 200 μm for A-D and I-L, 20 μm for E-H. EXPRESSION / LABELING:
|
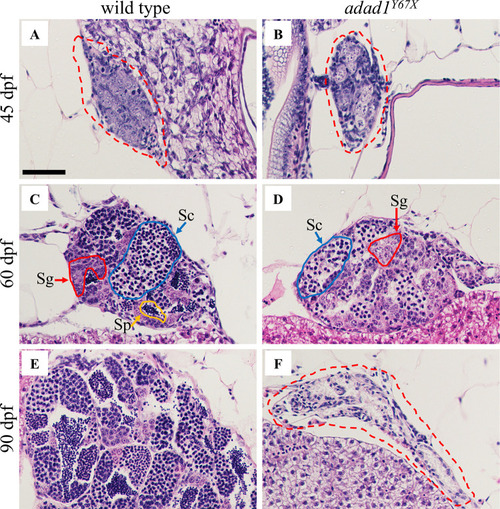
Histology of wild-type and A-B: At 45 dpf, germ cells are present in both the wild-type (N = 8) (A) and mutant (N = 8) (B) testes. C-D: At 60 dpf, spermatogonia (Sg, red outline) and spermatocytes (Sc, blue outline) are present in both wild-type (N = 10) (C) and mutant (D), but the mutant lacks mature sperm (N = 10) (Sp, yellow outline). E-F: At 90 dpf, the wild-type testis is larger with abundant sperm (N = 6) (E) whereas the mutant testis is small and devoid of germ cells (N = 6) (F). Dotted red lines outline the gonads in A, B and F. Scale bar: 50 μm. PHENOTYPE:
|
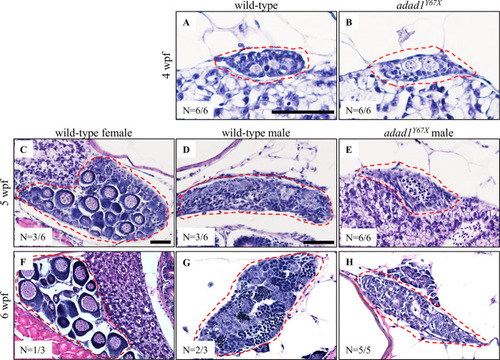
Hematoxylin-eosin staining on 28, 35, and 42 dpf wild-type and mutant gonads. A-B: At 28 dpf, gonads are undifferentiated in wild-type (A) and PHENOTYPE:
|
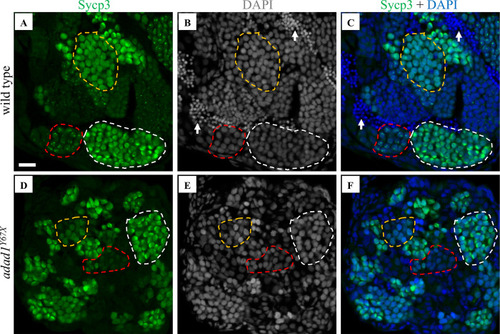
Immunostaining with meiotic marker Sycp3. A-F: Sycp3 immunofluorescence (green) and DAPI nuclear stain (white in B, E and blue in C, F) on 60 dpf wild-type (A-C) and PHENOTYPE:
|
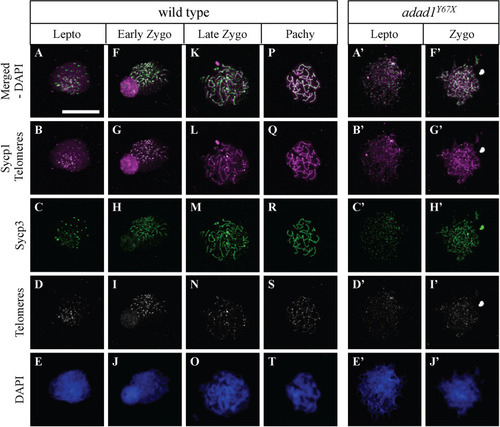
Telomere and synaptonemal complex protein labelling on meiotic chromosome spreads. A-T: Wild-type chromosome spreads have leptotene (A-E), zygotene (F-O), and pachytene (P-T) stage cells. A’-J’: Chromosome spreads from PHENOTYPE:
|
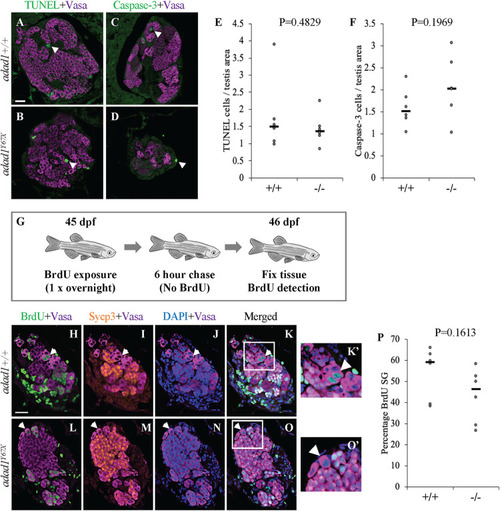
Apoptosis and proliferation are not affected in A-F: Cell death assays in 60 dpf PHENOTYPE:
|
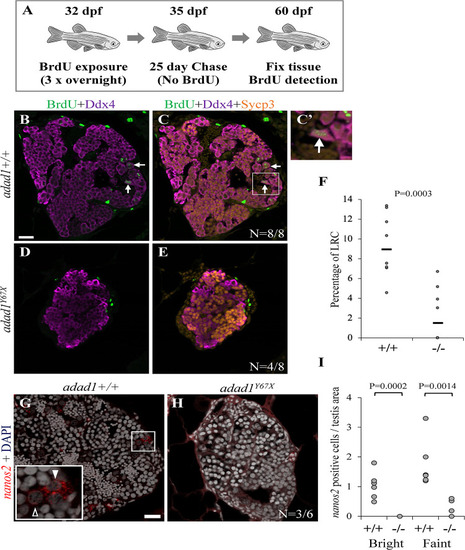
Label retaining cell assays (LRC) to identify spermatogonial stem cells. A: 32 dpf fish were treated with BrdU three times for about 16 hours per treatment (overnight) followed by a 25 day chase where fish were in water with no BrdU. At the end of the chase period, fish were fixed and processed for BrdU detection. B-F: Wild-type testes all had LRCs (B-C, arrows) with median percentage of 9.34% out of the total spermatogonia (N = 8 fish) (F). Four out of eight mutant ( PHENOTYPE:
|
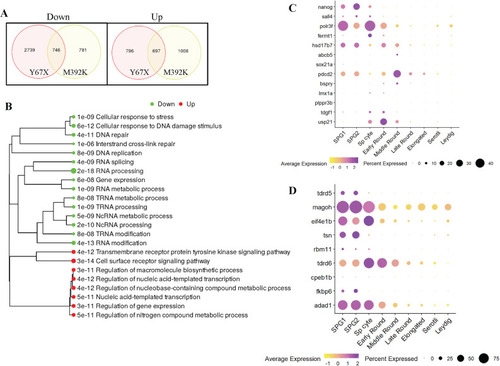
Bulk RNAseq from wild-type and mutant testes. A: Venn diagrams showing numbers of differentially expressed genes in each mutant line compared to their wild-type siblings using fold change >1.5 and false discovery rate (FDR) <0.05 as the cutoff. B: Gene ontogeny pathway analysis performed on genes that were dysregulated in both |

ZFIN is incorporating published figure images and captions as part of an ongoing project. Figures from some publications have not yet been curated, or are not available for display because of copyright restrictions. PHENOTYPE:
|