FIGURE SUMMARY
Title

Haematopoietic stem and progenitor cell heterogeneity is inherited from the embryonic endothelium

Authors
Ghersi, J.J., Baldissera, G., Hintzen, J., Luff, S.A., Cheng, S., Xia, I.F., Sturgeon, C.M., Nicoli, S.
Source
Full text @ Nat. Cell Biol.

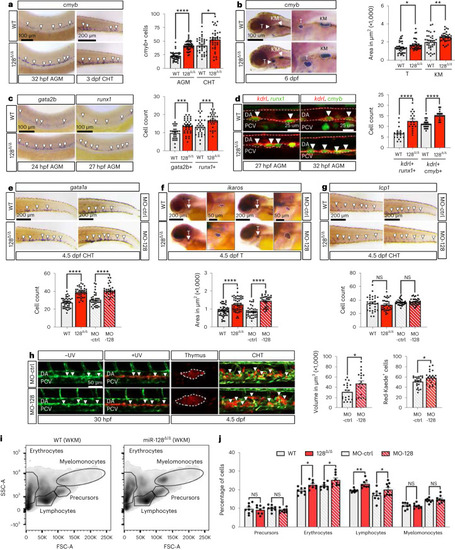
nHSPC development and blood lineages are altered in miR-128Δ/Δ.

a, WISH against cmyb at 32 hpf and 3 dpf in WT or miR-128Δ/Δ (128Δ/Δ) AGM (n = 39 (WT) and 42 (128Δ/Δ) embryos; P < 0.0001) and CHT (n = 33 (WT) and 48 (128Δ/Δ) embryos; P = 0.0151) (3 independent experiments, two-tailed Mann–Whitney test). b, WISH against cmyb at 6 dpf in WT (thymus n = 36 and KM n = 36 embryos; P = 0.0133) and 128Δ/Δ (thymus n = 35 and KM n = 36 embryos; P = 0.0033; 3 independent experiments; two-tailed Mann–Whitney test). c, WISH against gata2b (n = 27 (WT) and 35 (128Δ/Δ) embryos; P = 0.0005) and runx1 (n = 32 (WT) and 30 (128Δ/Δ) embryos; P = 0.0009; 3 independent experiments; two-tailed Mann–Whitney test). d, Confocal images of Tg(kdrl:mCherrys896,cmyb:GFPzf169) (n = 18 (WT) and 19 (128Δ/Δ) embryos; P < 0.0001) and Tg(kdrl:mCherrys896,runx1:GFPy509) (n = 29 (WT) and 31 (128Δ/Δ) embryos; P < 0.0001) AGM at 27 and 32 hpf, respectively. Quantification represents runx1+, kdrl+ (hemECs) and cmyb+, kdrl+ (nHSPCs) cells (3 independent experiments; two-tailed Mann–Whitney test). eg, WISH of gata1a (n = 40 (WT), 37 (128Δ/Δ), 34 (MO-ctrl) and 31 (Mo-128) embryos; P < 0.0001) (e), ikaros (n = 48 (WT); 48 (128Δ/Δ), 37 (MO-ctrl) and 34 (Mo-128) embryos; P < 0.0001) (f) and lcp1 (n = 29 (WT), 32 (128Δ/Δ), 36 (MO-ctrl), 38 (Mo-128) embryos; P = 0.0511 and 0.4257) (g) at 4.5 dpf with their quantification (3 independent experiments; two-tailed Mann–Whitney test). h, Confocal live imaging of Tg(fli1a:Gal4ubs4,UAS:Kaederk8), ± UV (photoconversion) in the AGM. Quantification represents the red thymus area (MO-ctrl, 20; Mo-128, 19 embryos; P = 0.0151) and the number of red cells in the CHT (MO-ctrl, 19; Mo-128, 22 embryos; P = 0.0462; 3 independent experiments; two-tailed Mann–Whitney test). i, Flow cytometry analysis of 1-month-old dissected whole (W)KM WT, 128Δ/Δ. j, Quantification of cell population identified by flow cytometry (n = 8 (WT), 8 (128Δ/Δ), 8 (MO-ctrl) and 9 (MO-128) zebrafish; two-way ANOVA with multiple comparisons). All quantifications are represented with mean ± s.e.m. NS, not significant: P > 0.05, *P ≤ 0.05, **P ≤ 0.01, ***P ≤ 0.001, ****P ≤ 0.0001. Arrowheads indicate cells stained by WISH and IF and cells photoconverted in h. T, thymus; DA, dorsal aorta; PCV, posterior cardinal vein; SSC-A, side scatter A; FSC-A, forward scatter A.

Source data

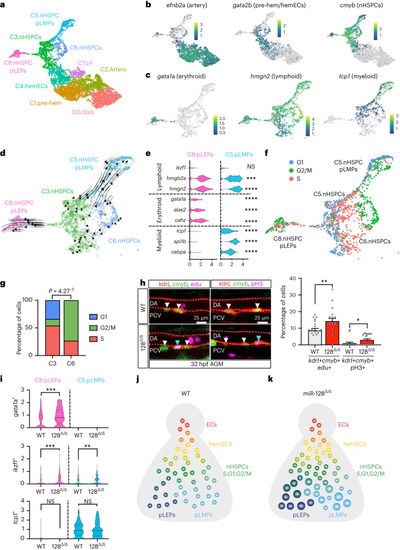
nHSPC heterogeneity is defined by cell cycle and lineage bias phenotypes and regulated by miR-128.

a, UMAP of defined EHT cluster cells from kdr+ ECs in the tail of WT and 128Δ/Δ at 26 hpf. b, UMAP representing efnb2a, gata2b and cmyb expression normalized with Z-score. c, UMAP of gata1a, hmgn2 and lcp1 expression normalized with Z-score, in nHSPC cmyb+ clusters (C3, C6, C8 and C5). d, RNA velocity trajectories in nHSPC clusters showing that C8.nHSPC pLEPs and C5.nHSPC pLMPs are terminal states of C3.nHSPCs and C6.nHSPCs. e, Violin plot of lymphoid (ikzf1, P > 0.9999; hmgb2a, P = 0.0001; hmgn2, P < 0.0001), erythroid (gata1a, P < 0.0001; alas2, P < 0.0001; cahz, P < 0.0001) and myeloid (lcp1, P < 0.0001; spi1b, P < 0.0001; cebpa, P < 0.0001) markers in WT cells of C8.nHPSC pLEPs and C5.nHSPC pLMPs. Statistics represent the comparison between C8.nHSPC pLEPs and C5.nHSPC pLMPs for each gene (ordinary one-way ANOVA). f, UMAP cell cycle analysis on nHSPC clusters. g, Quantification of S, G2/M and G1 phase in C3. and C6.nHSPCs. C3.nHSPCs cells are mainly in S phase and G1, while C6. nHSPCs in G2/M (two-tailed Student’s t-test with Bonferroni post-hoc correction). h, Confocal images of IF using anti-RFP, anti-GFP and EdU staining (n = 22 (WT) and 20 (128Δ/Δ) embryos; P = 0.0032) or anti-pH3 (n = 18 (WT) and 24 (128Δ/Δ) embryos; P = 0.0208) in Tg(kdrl:mCherrys896,cmyb:GFPzf169) AGM at 32 hpf. S phase and G2/M nHSPCs are increased (kdrl+, cmyb+, EdU+ or pH3+ blue arrowheads and kdrl+, cmyb+, EdU− or pH3− white arrowheads) in miR-128Δ/Δ (three independent experiments; two-tailed Mann–Whitney test). i, Violin plot of gata1a (P = 0.0004), ikzf1 (P = 0.0006 and 0.0015) and lcp1 (P = 0.4505 and 0.5383) expression in clusters C8.nHPSC pLEPs and C5.nHSPC pLMPs per genotype (Mann–Whitney test). j,k, Model of nHSPC heterogeneity acquired during EHT in the AGM at 26 hpf WT (j) and 128Δ/Δ (k). 128Δ/Δ nHSPC heterogeneity is biased towards S and G2/M nHSPCs (green circles), and erythroid and lymphoid primed nHSPCs (blue circles, bigger size represents increase gene expression but not number). Not signifcant (NS): P > 0.05. **P ≤ 0.01, ***P ≤ 0.001. LP, lymphatic progenitor; ISVs, intersegmental vessels; DA, dorsal aorta; PCV, posterior cardinal vein.

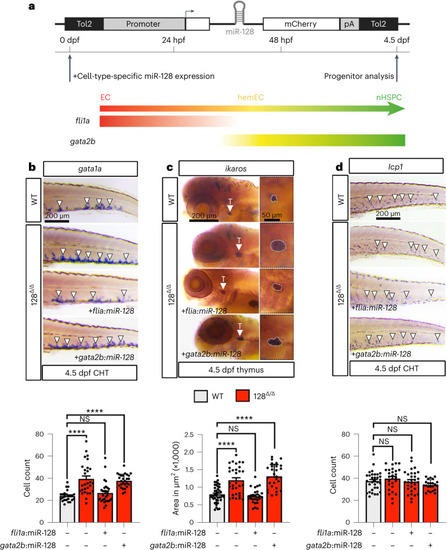
miR-128 function in ECs to regulate HSPC heterogeneity before EHT.

a, Schematic representation of the transgene used to express WT miR-128 gene in zebrafish ECs (via flia1) or hemECs (via gata2b). For gata2b expression, we used the Tg(gata2b:Gal4sd32) line and created the UAS:miR-128 plasmid, while for fli1a expression we created fli1a:miR-128 plasmid. One-cell-state embryo was injected with tol2 mRNA and the indicated plasmids, and WISH was performed against gata1a, ikzf1 and lcp1 at 4.5 dpf, respectively. bd, WISH of gata1a (n = 27 (WT), 28 (128Δ/Δ), 27 (128Δ/Δ + fli1a), 29 (128Δ/Δ + gata2b) embryos) (b) and ikaros (n = 41 (WT); 31 (128Δ/Δ), 28 (128Δ/Δ + fli1a), 28 (128Δ/Δ + gata2b) embryos) (c) and lcp1 (n = 32 (WT), 27 (128Δ/Δ), 30 (128Δ/Δ + fli1a), 23 (128Δ/Δ + gata2b) embryos) (d) at 4.5 dpf and relative cells quantification as indicated. fli1a endothelial expression of miR-128 WT gene rescues to WT level the increase of erythroid and lymphoid progenitors of miR-128Δ/Δ, while gata2b hemEC expression of miR-128 does not rescue the increase of erythroid and lymphoid progenitors (3 independent experiments, ordinary one-way ANOVA with Tukey’s multiple comparison). All quantifications are represented with mean ± s.e.m. NS, not significant; P > 0.05, ****P ≤ 0.0001.

miR-128 function before EHT is conserved in hPSCs.

a, Schematic of HSPC development in vitro using hPSCs and treated as indicated with antagomiR-128 or scramble miR as control at different cell stages. b,c, Colony-forming cell assay quantification of erythroid (BFU-E, CFU-E) and myeloid (CFU-M, CFU-G, CFU-GM) of HOXA+ programme (definitive haematopoiesis) during stage 1 (b) or stage 2 (c). d, Colony-forming cell quantification of erythroid (Ery-P, BFU-E) and myeloid (CFU-M, CFU-G, CFU-GM) of HOXA/low− programme (primitive haematopoiesis) (three independent experiments). All Quantification are represented with mean ± s.e.m. NS, not significant; P > 0.05, **P ≤ 0.01, ****P ≤ 0.0001. HE, haemogenic endothelium; CFC, colony-forming cell; BFU-E, burst-forming units erythroid; CFU-E, colony-forming units of erythroid; CFU-G, colony-forming units of granulocyte; CFU-M, colony-forming units of myeloid; CFU-GM, colony-forming units of mixed granulocyte/myeloid.

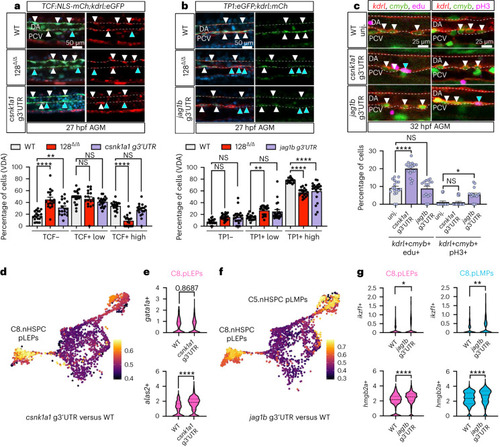
miR-128 regulation of Notch (via jag1b) and Wnt (via csnk1a1) signalling in the EHT control nHSPC heterogeneity.

a,b, Confocal lateral view of IF zebrafish tail at 27 hpf of Tg(TCF:NLS-mCherryia5,kdrl:eGFPzn1) (n = 20 (WT), 18 (128Δ/Δ) and 19 (csnk1a1 g3′UTR) embryos) (a) and Tg(TP1:eGFPum14,kdrl:mCherrys896) (n = 18 (WT), 20 (128Δ/Δ) and 21 (jag1b g3′UTR) embryos) (b), Wnt and Notch reported lines, respectively. Quantification of Wnt and Notch kdrl+ cells based on reporter intensity. Arrowheads represent kdrl+, TCF+ or TP1+ high (white) or low/negative (blue) cells. Cell quantification is reported in the ventral floor of the dorsal aorta (VDA) (three independent experiments; ordinary one-way ANOVA with Tukey’s multiple comparison). c, Confocal images of Tg(kdrl:mCherrys896,cmyb:GFPzf169) WT and g3′UTR mutants AGM at 32 hpf. Replicative nHSPCs are increased (kdrl+, cmyb+, EdU+, blue arrowhead) (n = 19 (WT), 17 (csnk1a1 g3′UTR) and 15 (jag1b g3′UTR) embryos) in the csnk1a1 g3′UTR while unchanged in jag1b g3′UTR. G2/M nHSPCs (kdrl+, cmyb+, pH3+, blue arrowhead) (n = 17 (WT), 19 (csnk1a1 g3′UTR), 16 (jag1b g3′UTR) embryos) are increased in the jag1b g3′UTR while unchanged in csnk1a1 g3′UTR (3 independent experiments; ordinary one-way ANOVA with Tukey’s multiple comparison). d, scRNA-seq analysis of kdrl+ cells experimental perturbation among genotype using MELD (Methods) assessed by the comparison between csnk1a1 g3′UTR versus WT, showing C8 as the most perturbed cluster. e, Violin plot of erythroid markers (gata1a and alas2, P < 0.0001) within C8.nHSPC pLEPs (Mann–Whitney test). f, MELD assessed by the comparison between jag1b g3′UTR versus WT, showing C8 and C5 as the most perturbed clusters (Methods). g, Violin plot of lymphoid markers (ikzf1, P = 0.0315 (C8) and 0.0099 (C5) and hmgb2a, P < 0.0001) within C8.nHSPC pLEPs and C5.nHSPC pLMPs (two-tailed Mann–Whitney test). All quantifications are represented with mean ± s.e.m. NS, not significant; P > 0.05, *P ≤ 0.05, **P ≤ 0.01, ****P ≤ 0.0001. DA, dorsal aorta; PCV, posterior cardinal vein.

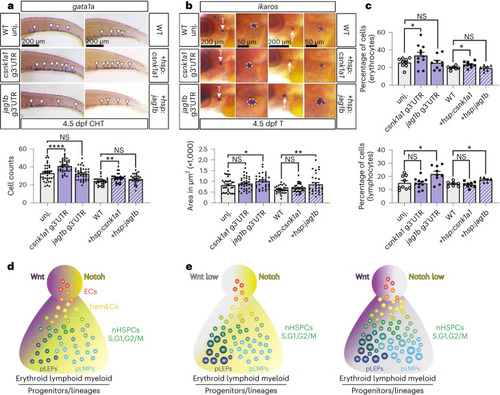
miR-128 regulation of jag1b and csnk1a1 in the embryonic EHT control long-term blood lineages.

a,b, Quantification of erythroid (a) and lymphoid (b) progenitors by WISH against gata1a (n = 37 (WT), 37 (csnk1a1 g3′UTR), 37 (jag1b g3′UTR), 31 (WT), 30 (hsp:csnk1a1) and 28 (hsp:jag1b) embryos) and ikaros (n = 32 (WT), 34 (csnk1a1 g3′UTR), 32 (jag1b g3′UTR), 31 (WT), 31 (hsp:csnk1a1) and 30 (hsp:jag1b) embryos), respectively, at 4.5 dpf CHT or thymus. WT and hsp:csnk1a1 and hsp:jag1b were heat shocked at 24 hpf. csnk1a1 de-repression or transient gain-of-function regulate erythroid progenitor formation, while jag1b manipulations regulate lymphoid progenitors (three independent experiments; ordinary one-way ANOVA with Tukey’s multiple comparison). c, Quantification of blood cell population identified by flow cytometry of ~2-month-old WKM dissected from samples treated as in h and i. Erythrocyte fraction is increased in csnk1a1 g3′UTR and hsp:csnk1a1, while lymphoid cells fraction is increased in jag1b g3′UTR and hsp:jag1b after heat shock at 24 hpf (n = 9 (WT), 11 (csnk1a1 g3′UTR), 9 (jag1b g3′UTR), 7 (WT), 9 (hsp:csnk1a1) and 7 (hsp:jag1b) zebrafish; two-way ANOVA with multiple comparisons). d, Proposed model of nHSPC heterogeneity regulated by miR-128 regulation on Wnt and Notch signalling in vascular endothelia cells before EHT. Vascular signalling, like Wnt (purple) and Notch (yellow), limits the production of a heterogeneous pool of nHSPCs in the AGM. e, Diminishment of Wnt (light grey), like after de-repression or gain of function of csnk1a1 in the EHT, results in an increase of replicative (S), and erythroid-biased nHSPCs in the AGM and relative erythroid progenitors and mature lineages. Diminishment of Notch (light grey), like after de-repression or gain of function of jag1b in the EHT, increases G2/M nHSPCs and lymphoid-biased nHSPCs in the AGM and relative lymphoid progenitors and mature cells. All quantifications are represented with mean ± s.e.m. NS, not significant; P > 0.05, *P ≤ 0.05, **P ≤ 0.01, ****P ≤ 0.0001. T, thymus.

Acknowledgments
This image is the copyrighted work of the attributed author or publisher, and ZFIN has permission only to display this image to its users. Additional permissions should be obtained from the applicable author or publisher of the image. Full text @ Nat. Cell Biol.