Figure Caption
Fig. 2
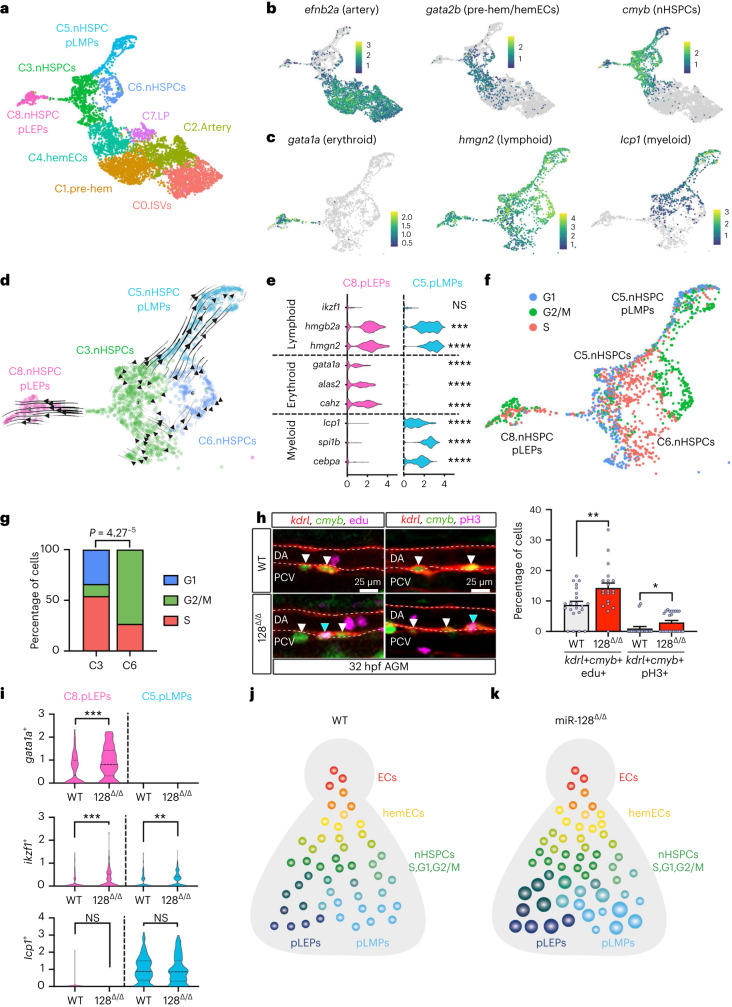
nHSPC heterogeneity is defined by cell cycle and lineage bias phenotypes and regulated by miR-128.
a, UMAP of defined EHT cluster cells from kdr+ ECs in the tail of WT and 128Δ/Δ at 26 hpf. b, UMAP representing efnb2a, gata2b and cmyb expression normalized with Z-score. c, UMAP of gata1a, hmgn2 and lcp1 expression normalized with Z-score, in nHSPC cmyb+ clusters (C3, C6, C8 and C5). d, RNA velocity trajectories in nHSPC clusters showing that C8.nHSPC pLEPs and C5.nHSPC pLMPs are terminal states of C3.nHSPCs and C6.nHSPCs. e, Violin plot of lymphoid (ikzf1, P > 0.9999; hmgb2a, P = 0.0001; hmgn2, P < 0.0001), erythroid (gata1a, P < 0.0001; alas2, P < 0.0001; cahz, P < 0.0001) and myeloid (lcp1, P < 0.0001; spi1b, P < 0.0001; cebpa, P < 0.0001) markers in WT cells of C8.nHPSC pLEPs and C5.nHSPC pLMPs. Statistics represent the comparison between C8.nHSPC pLEPs and C5.nHSPC pLMPs for each gene (ordinary one-way ANOVA). f, UMAP cell cycle analysis on nHSPC clusters. g, Quantification of S, G2/M and G1 phase in C3. and C6.nHSPCs. C3.nHSPCs cells are mainly in S phase and G1, while C6. nHSPCs in G2/M (two-tailed Student’s t-test with Bonferroni post-hoc correction). h, Confocal images of IF using anti-RFP, anti-GFP and EdU staining (n = 22 (WT) and 20 (128Δ/Δ) embryos; P = 0.0032) or anti-pH3 (n = 18 (WT) and 24 (128Δ/Δ) embryos; P = 0.0208) in Tg(kdrl:mCherrys896,cmyb:GFPzf169) AGM at 32 hpf. S phase and G2/M nHSPCs are increased (kdrl+, cmyb+, EdU+ or pH3+ blue arrowheads and kdrl+, cmyb+, EdU− or pH3− white arrowheads) in miR-128Δ/Δ (three independent experiments; two-tailed Mann–Whitney test). i, Violin plot of gata1a (P = 0.0004), ikzf1 (P = 0.0006 and 0.0015) and lcp1 (P = 0.4505 and 0.5383) expression in clusters C8.nHPSC pLEPs and C5.nHSPC pLMPs per genotype (Mann–Whitney test). j,k, Model of nHSPC heterogeneity acquired during EHT in the AGM at 26 hpf WT (j) and 128Δ/Δ (k). 128Δ/Δ nHSPC heterogeneity is biased towards S and G2/M nHSPCs (green circles), and erythroid and lymphoid primed nHSPCs (blue circles, bigger size represents increase gene expression but not number). Not signifcant (NS): P > 0.05. **P ≤ 0.01, ***P ≤ 0.001. LP, lymphatic progenitor; ISVs, intersegmental vessels; DA, dorsal aorta; PCV, posterior cardinal vein.
Acknowledgments
This image is the copyrighted work of the attributed author or publisher, and
ZFIN has permission only to display this image to its users.
Additional permissions should be obtained from the applicable author or publisher of the image.
Full text @ Nat. Cell Biol.