
- Title
-
Particulate matter induces arrhythmia-like cardiotoxicity in zebrafish embryos by altering the expression levels of cardiac development- and ion channel-related genes
- Authors
- Park, K.H., Choi, Y.J., Min, W.K., Lee, S.H., Kim, J., Jeong, S.H., Lee, J.H., Choi, B.M., Kim, S.
- Source
- Full text @ Ecotoxicol. Environ. Saf.

Collection of particulate matter (PM) and its developmental toxicity in zebrafish embryos. (A) Images of high-volume air sampler with a quartz filter. Percentage mortality (B) and hatching rates (C) of zebrafish embryos exposed to PM per concentration (10 %, 25 %, and 50 % PM solution). dpf is the number of days post-fertilization. All experiments were conducted in triplicates. Two-way analysis of variance (ANOVA) with Tukey’s multiple comparison test (n = 20 per group; *p < 0.05, **p < 0.01, ***p < 0.001, and ****p < 0.0001). |

Cardiac malformation in zebrafish embryos exposed to PM. (A–D) Representative images of the cardiac morphology after PM exposure at 3 days post-fertilization (dpf). Red dotted line indicates the pericardial sac, and red arrow indicates venous congestion. Scale bar, 500 μM. (E) Relative heart area (%) of embryos. Kruskal–Wallis test (n = 80, 71, 86, and 48 per group; ****p < 0.0001; n.s., not significant.) (F) Percentage of embryos with pericardial edema per group. |
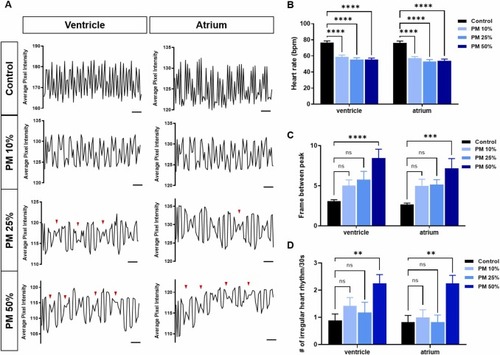
Cardiac dysfunction induced by PM exposure. (A) Representative images of the cardiac rhythm (for 30 s) in the ventricle and atrium. Red arrowheads indicate the irregular rhythms. Scale bar, 3 s (B) Average heart rate per minute in the ventricle and atrium. Two-way ANOVA with Tukey’s multiple comparison test (n = 36, 19, 40, and 18 per group; ****p < 0.0001). (C) Average number of frames between peaks. (D) Average number of irregular heart rhythms. Two-way ANOVA with Tukey’s multiple comparison test (n = 17, 15, 15, and 16 per group; **p < 0.01, ***p < 0.001, and ****p < 0.0001; n.s., not significant.). |

Vasculature malformation and defect in blood flow induced by PM exposure. (A–D) Representative images of the blood vasculature of Tg(fli1a:egfp) zebrafish embryos at 3 dpf. White arrows indicate the intersegmental vessels with abnormal branches. Scale bar, 50 μM. (E) Flow rate of blood cells in PM-exposed zebrafish embryos. Kruskal–Wallis test (n = 16 per group; ***p < 0.001 and ****p < 0.0001; n.s., not significant.). |

mRNA expression levels in zebrafish embryos exposed to PM. (A) Quantitative reverse transcription-polymerase chain reaction (qRT-PCR) of genes involved in cardiac development. (B) qRT-PCR of genes involved in cardiac ion channels. Two-way ANOVA with Tukey’s multiple comparison test (n = 3, each replicate had 20 zebrafish embryos; *p < 0.05, **p < 0.01, and ****p < 0.0001; n.s., not significant.). |

Cardiac toxicity of PM-containing heavy metal mixtures (HMMs). (A–C) Representative images of the cardiac morphology after HMM exposure. Red dotted line indicates the pericardial sac, and red arrow indicates venous congestion. Scale bar, 500 μM. (D) Relative heart area (%) of embryos after HMM exposure. (E) Representative images of cardiac rhythm (for 30 s) in the ventricle and atrium. Red arrowheads indicate the irregular rhythm. Scale bar, 3 s. Average heart rate (bpm) (F), average number of frames between peaks (G), and average number of irregular heart rhythms (H). Two-way ANOVA with Tukey’s multiple comparison test (n = 15 per group; *p < 0.05, **p < 0.01, ***p < 0.001, and ****p < 0.0001; n.s., not significant.) (I) qRT-PCR of genes involved in cardiac development. (J) qRT-PCR of genes involved in cardiac ion channels. Two-way ANOVA with Tukey’s multiple comparison test (n = 3, each replicate had 20 zebrafish embryos; *p < 0.05, **p < 0.01, ***p < 0.001, and ****p < 0.0001; n.s., not significant). |