FIGURE SUMMARY
Title

Tissue-Engineered Disease Modeling of Lymphangioleiomyomatosis Exposes a Therapeutic Vulnerability to HDAC Inhibition

Authors
Pietrobon, A., Yockell-Lelièvre, J., Melong, N., Smith, L.J., Delaney, S.P., Azzam, N., Xue, C., Merwin, N., Lian, E., Camacho-Magallanes, A., Doré, C., Musso, G., Julian, L.M., Kristof, A.S., Tam, R.Y., Berman, J.N., Shoichet, M.S., Stanford, W.L.
Source
Full text @ Adv Sci (Weinh)

Hydrogel culture of stem cell‐derived disease models exhibits features of LAM. A) Representative immunofluorescence images of WT and TSC2−/− cells. Inset showing punctate PMEL and fibril ACTA2 staining. Scale bars of 100. B) VEGF‐D secreted into conditioned media measured by ELISA, following 16 h incubation in serum‐free media ± 20 × 10−9m rapamycin (mean ± SD; * = p < 0.05 by one‐way analysis of variance (ANOVA); n = 9–10). C–E) Visualization of LAM cell invasion after 3 days in hydrogel culture, as C) a schematic, D) brightfield image of single Z plane, scale bars of 250 µm, and E) computational reconstruction of cellular spatial positions. F) Median invasion distance of cellular populations plated on the hydrogel and cultured for 3 days ± 20 × 10−9m rapamycin (mean ± SD; * = p < 0.05 by one‐way ANOVA with Bonferroni post hoc comparisons; n = 124). G) Percentage of cells invaded past fixed threshold set by median invasion distance of genotype‐matched vehicle control. Cells were cultured and treated for 3 days (10 × 10−6m GM6001, a pan‐MMP inhibitor, and 20 × 10−6m Y27632, a ROCK inhibitor, mean ± SD; * = p < 0.05 by one‐way ANOVA with Bonferroni post hoc comparisons; n = 4). H) Schematic of the sample conditions tested in the bulk RNA‐seq experiment. NT = no treatment, Rapa = rapamycin treatment (20 × 10−9m, 72 h). I) Principal components analysis (PCA) of bulk RNA‐seq samples. J) Heatmap and hierarchal clustering of differentially expressed genes (DEGs) between TSC2−/ and WT samples, and between hydrogel and plastic samples, while controlling for the reciprocal covariate. Left panel: transcript expression for plastic and hydrogel cultures was averaged. Right panel: transcript expression for WT and TSC2−/− samples was averaged. DEG analysis was performed with no treatment samples; genes noted as differentially expressed if FDR < 0.05 and |log2FC| > 1. K) Overlap in DEG between genotype and ECM gene lists and LAM cell signature gene list.[23] Genes noted as DE if FDR < 0.05. L) Percentage of EdU+ (proliferating) cells from 3 h pulse (5 × 10−6m), after 3 days cultured on plastic or hydrogel ± 20 × 10−9m rapamycin (mean ± SD; * = p < 0.05 by one‐way ANOVA with Bonferroni post hoc comparisons; n = 5).

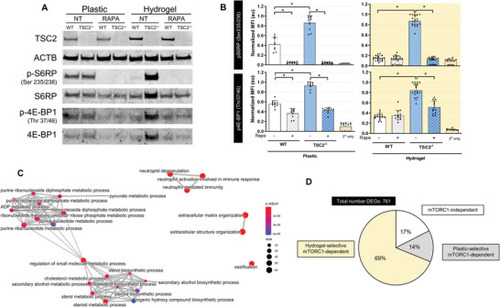
Hydrogel culture potentiates differential mTORC1‐signaling between WT and TSC2−/− cells. A) Low input Western blot of protein collected from cells cultured for 3 days on plastic or hydrogel ± 20 × 10−9m rapamycin. NT = no treatment, Rapa = rapamycin treatment. B) Quantification of immunofluorescence values reported in normalized (scaled by replicate maximum value) mean fluorescence intensity. Each point indicates the mean fluorescence intensity from a well of cells cultured on hydrogel or plastic for 3 days ± 20 × 10−9m rapamycin. Secondaryonly values are determined from wells probed with fluorescent secondary antibody only (mean ± SD; * = p < 0.05 by one‐way ANOVA with Bonferroni post hoc comparisons; n = 9–20). C) Network analysis of GO terms enriched in the list of DEGs found significant (FDR < 0.05) in the interaction between genotype and culture substrate. The 25 most significantly enriched terms are plotted. D) Classification of DEGs according to pattern of expression across genotypes, ECM condition, and in the presence or absence of rapamycin. Gene clusters and classification scheme shown in Figure S2B,C in the Supporting Information.

3D drug screen identifies HDAC inhibitors as anti‐invasive and selectively cytotoxic toward TSC2−/− LAM cells. A) Representative maximum intensity projection image of TSC2−/− cells in hydrogel culture for 3 days ± 200 × 10−9m carfilzomib. Scale bars of 250 µm. B) Computational reconstruction of cellular spatial positions following 3 day hydrogel culture of TSC2−/− cells ± 40 × 10−9m dasatinib. Note that treated and untreated were in separate wells; cells were plotted in the same volume for ease of visualizing relative distances traveled. C) Highest development status reported for the 800 compounds contained in the curated kinase inhibitor and tool compound libraries. A 3D drug screen was conducted on WT and TSC2−/− cells following 3 day treatment with 5 × 10−6m compounds ± 20 × 10−9m rapamycin. D) Compound invasion modulation plotted against cytotoxicity, aggregating results across genotype and rapamycin treatment. Fixed invasion threshold determined by median invasion distance of untreated controls. Hexagonal plot employed to demonstrate compound densities. E) Waterfall plot of compound invasion z‐scores in ranked order; positive values indicate invasion potentiation, while negative values indicate invasion attenuation. Compounds conferring statistically significant invasion modulation highlighted in black. Data presented for TSC2−/−, no rapamycin treatment condition. F) Number of compounds significantly modulating invasion (potentiating or attenuating) for each genotype in the presence of absence of 20 × 10−9m rapamycin. Bubble area proportional to number of statistically significant targets. G) Overlap of compounds identified as anti‐invasive in each listed condition. H) Waterfall plots of compound selective toxicity z‐scores in ranked order; positive values indicate increased cytotoxicity toward TSC2−/− cells, negative values indicate increased cytotoxicity toward WT cells. Compounds conferring statistically significant selective cytotoxicity highlighted in black. I) Overlap of compounds identified to be selectivity cytotoxic toward TSC2−/− cells, with or without 20 × 10−9m rapamycin. J) Enrichment plot for compounds annotated to target HDACs, derived from an adapted implementation of GSEA. Hits (black vertical lines) in the red region indicate compounds with a favorable effect, hits in the blue region indicate compounds with an undesirable effect. K) Top 10 most statistically significant GO terms. Analysis performed using targets identified as statistically significantly enriched in screen data by Elion algorithm.

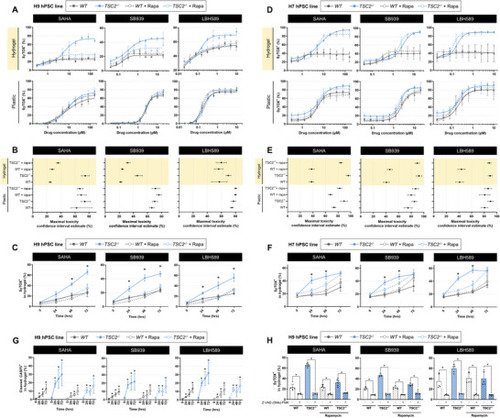
Three safe‐in‐human HDAC inhibitors induce mTORC1‐dependent selective cytotoxicity exclusively in hydrogel culture. A,D) Dose–response cytotoxicity curves of H9 (panel A) and H7 (panel D) cells treated with the indicated HDAC inhibitor for 3 days while cultured on plastic or hydrogel ± 20 × 10−9m rapamycin. Data fit via four‐parameter logistic regression (mean ± SD; n = 3). B,E) Confidence intervals of HDAC inhibitor maximal toxicity, estimated by four‐parameter logistic regression models generated in panels (A) and (D). C,F) Percentage of SyTOX+ cells following temporal HDAC inhibitor treatment (20 × 10−6m SAHA, 5 × 10−6m SB939, 1 × 10−6m LBH589) of H9 (panel C) and H7 (panel F) cells cultured in hydrogel ± 20 × 10−9m rapamycin (mean ± SD; * = p < 0.05 by two‐factor ANOVA with Bonferroni post hoc comparisons; n = 3). G) Percentage of cells expressing cleaved caspase 3 (CASP3), following 3 day treatment with HDAC inhibitors in hydrogel (20 × 10−6m SAHA, 5 × 10−6m SB939, and 1 × 10−6m LHB589, mean ± SD; * = p < 0.05 by two‐way ANOVA with Dunnett post hoc comparisons to 0 h for each group; n = 5–6). H) Percentage of SyTOX+ cells following 3 day HDAC inhibitor treatment (20 × 10−6m SAHA, 5 × 10−6m SB939, and 1 × 10−6m LHB589) in hydrogel ± 25 × 10−6m Z‐VAD (OMe)‐FMK (mean ± SD; * = p < 0.05 by one‐way ANOVA with Bonferroni post hoc comparisons; n = 4–6).

HDAC inhibitors attenuate cell invasion independent of cytotoxicity. A) Live TSC2−/− cells (H9 top panels, H7 bottom panels) invaded past fixed threshold set by median invasion distance of vehicle control, upon 3 day HDAC inhibitor treatment ± 20 × 10−9m rapamycin (mean ± SD; * = p < 0.05 by two‐way ANOVA with Dunnett post hoc comparison to untreated; n = 3). B) Computational reconstruction of live cell spatial positions upon 3 day hydrogel culture of TSC2−/− cells ± HDAC inhibitor (HDACi) treatment (20 × 10−6m SAHA, 5 × 10−6m SB939, 1 × 10−6m LBH589). Note that treated and untreated cells were in separate wells; cells were plotted in the same volume for ease of visualizing relative distances traveled. C) Effect of 11 HDAC inhibitors on TSC2−/− live cell invasion ± 20 × 10−9m rapamycin. Fixed threshold set by median invasion distance of vehicle control. D) Aggregated effect of the 11 HDAC inhibitors presented in panel (C) (mean ± SD; * = p < 0.05 by two‐way ANOVA with Dunnett post hoc comparison to untreated for each group; n = 33 via 11 HDACi, n = 3 each).

HDAC inhibitors are anti‐invasive and selectively cytotoxic toward TSC2−/− cells xenotransplanted into zebrafish. A) Representative phase contrast image of 1 day post‐injection (dpi) zebrafish larvae injected with TSC2−/− mCherry+ cells into the hindbrain ventricle (hbv). B) Representative images of zebrafish larvae injected with mCherry+ WT or TSC2−/− cells into the hbv. Fish were imaged 1 and 4 dpi. Scale bars of 200 µm. C,D) Quantification of cell invasion using automated invasion analysis. Images analyzed in (D) were taken 4 dpi following 3 day treatment ± 20 × 10−9m rapamycin (mean ± SD; * = p < 0.05 by the Kruskal–Wallis test with Dunn's post hoc comparisons; n = 38–73). E) Number of mCherry+ cells detected per zebrafish following whole larvae dissociation at 4 dpi and analysis by flow cytometry. Samples were treated for 3 days ± 20 × 10−9m rapamycin. Each replicate is a pool of 15–20 zebrafish larvae (mean ± SD; * = p < 0.05 by one‐way ANOVA; n = 6). F) Percentage of CASP3+ cells in the mCherry+ population from whole larvae dissociation at 4 dpi, following 3 day treatment ± 20 × 10−9m rapamycin. Each replicate is a pool of 15–20 zebrafish larvae (mean ± SD; * = p < 0.05 by one‐way ANOVA; n = 5–6). G,H) Effect of 3 day HDAC inhibitor treatment (20 × 10−6m SAHA, 5 × 10−6m SB939, 1 × 10−6m LBH589) ± 20 × 10−9m rapamycin. G) Invasion scores calculated on images acquired 4 dpi (mean ± SD; * = p < 0.05 by the Kruskal–Wallis test with Dunn's post hoc comparison to vehicle‐treated; n = 27–73). H) Percentage of CASP3+ cells in the mCherry+ population from whole larvae dissociation at 4 dpi. Each replicate is a pool of 15–20 zebrafish larvae (mean ± SD; * = p < 0.05 by ANOVA with Dunnett post hoc comparison to vehicle‐treated; n = 3–6). Not all outliers in (C,D) and (G) are visualized due to trimmed axes (although outliers were included in mean ± SD and the statistical calculation).

Acknowledgments
This image is the copyrighted work of the attributed author or publisher, and ZFIN has permission only to display this image to its users. Additional permissions should be obtained from the applicable author or publisher of the image. Full text @ Adv Sci (Weinh)