IMAGE

Figure 2

ID
ZDB-IMAGE-231002-306
Source
Figures for Pietrobon et al., 2023
Image
Figure Caption

Figure 2

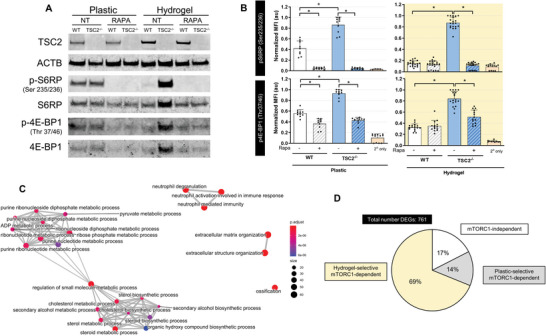
Hydrogel culture potentiates differential mTORC1‐signaling between WT and TSC2−/− cells. A) Low input Western blot of protein collected from cells cultured for 3 days on plastic or hydrogel ± 20 × 10−9m rapamycin. NT = no treatment, Rapa = rapamycin treatment. B) Quantification of immunofluorescence values reported in normalized (scaled by replicate maximum value) mean fluorescence intensity. Each point indicates the mean fluorescence intensity from a well of cells cultured on hydrogel or plastic for 3 days ± 20 × 10−9m rapamycin. Secondaryonly values are determined from wells probed with fluorescent secondary antibody only (mean ± SD; * = p < 0.05 by one‐way ANOVA with Bonferroni post hoc comparisons; n = 9–20). C) Network analysis of GO terms enriched in the list of DEGs found significant (FDR < 0.05) in the interaction between genotype and culture substrate. The 25 most significantly enriched terms are plotted. D) Classification of DEGs according to pattern of expression across genotypes, ECM condition, and in the presence or absence of rapamycin. Gene clusters and classification scheme shown in Figure S2B,C in the Supporting Information.

Acknowledgments
This image is the copyrighted work of the attributed author or publisher, and ZFIN has permission only to display this image to its users. Additional permissions should be obtained from the applicable author or publisher of the image. Full text @ Adv Sci (Weinh)