
- Title
-
Mechanism of Bisphenol F Affecting Motor System and Motor Activity in Zebrafish
- Authors
- Kim, Y., Kim, S.S., Park, B.H., Hwang, K.S., Bae, M.A., Cho, S.H., Kim, S., Park, H.C.
- Source
- Full text @ Toxics

Toxicity of BPF on mortality and hatching rate of zebrafish embryos and larvae. (A) Mortality of zebrafish exposed to BPF and control at 120 hpf. (B) Hatching rate of zebrafish exposed to BPF and control at 72 hpf. No embryos in the 22 mg/L exposure group hatched. (C) Representative LC curve graph of BPF. (D) Morphology of zebrafish larvae at 120 hpf exposed to BPF doses. n = 16 in each concentration; scale bar, 500 µm. * p < 0.05; ** p < 0.01; *** p < 0.001. |
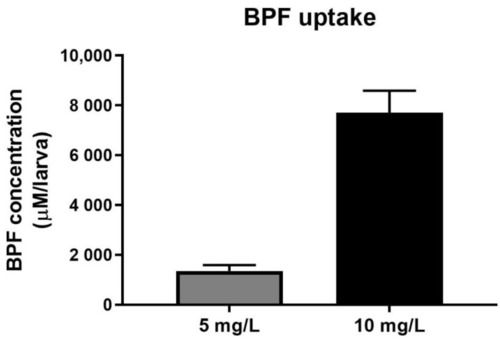
Measurement of BPF concentration in the zebrafish larvae. The concentration of BPF entering the body of zebrafish larvae exposed to 5 mg/L and 10 mg/L BPF for 5 days was measured. n = 30 for each concentration. |

Light-dark behavior test in BPF-exposed zebrafish larvae. (A) Zebrafish larvae at 5 dpf were adapted in light status for 20 min, and subjected to two cycles of 5 min of light/5 min of dark periods. (B,C) Velocity in light status and dark status. (D) Representative images of the transition for 5 min each in light and dark status. n = 48 in each concentration. Data are presented as means ± SD. *** p < 0.001. |

Characterization of the startle response of 5 dpf zebrafish larvae. (A) The distance moved was compared between spontaneous response and startle response after stimulus within each group. (B) The peak distance moved in response to the stimulus was compared immediately after the startle stimulus was provided. (C) Latency to startle time after stimulation was compared with that of the DMSO control group. n = 26 for DMSO control and BPF 5 mg/L, n = 13 for BPF 10 mg/L. Data are presented as means ± SD. n.s.—not significant, * p < 0.05; ** p < 0.01; *** p < 0.001. |

Toxic effects of BPF on motor axons and neurons of zebrafish larvae at 3 dpf. (A–C) Lateral views of the spinal cord of Tg(Olig2:dsRed) at 3 dpf. (D–F) Lateral views of the spinal cord of Tg(Hb9:mCherry) at 3 dpf. The motor neurons and interneurons expressed mCherry fluorescence. (G–I) Transverse section images of spinal cord of Tg(Hb9: GFP) zebrafish. The dead neurons (red spots) were confirmed through TUNEL assay. (J) The graph represents the length of olig2 positive motor axons. n = 12 for each concentration. (K) The graph represents the number of axonal branches per motor axon. n = 12 for each concentration. (L) The graph represents the number of Hb9 positive motor neurons. n = 15 for each concentration. Data are presented as means ± SD. n.s.—not significant, *** p < 0.001. (A–C) Scale bar, 100 µm. (D–F) Scale bar, 50 µm. ( G–I) Scale bar, 20 µm. |
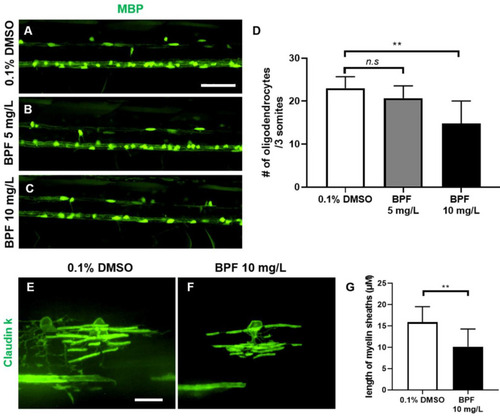
Toxic effects of BPF on oligodendrocytes of zebrafish larvae at 5 dpf. ( |

Effects of BPF on neurochemicals in zebrafish larvae at 5 dpf ( |