FIGURE SUMMARY
Title

Light-sheet autofluorescence lifetime imaging with a single-photon avalanche diode array

Authors
Samimi, K., Desa, D.E., Lin, W., Weiss, K., Li, J., Huisken, J., Miskolci, V., Huttenlocher, A., Chacko, J.V., Velten, A., Rogers, J.D., Eliceiri, K.W., Skala, M.C.
Source
Full text @ J. Biomed. Opt.

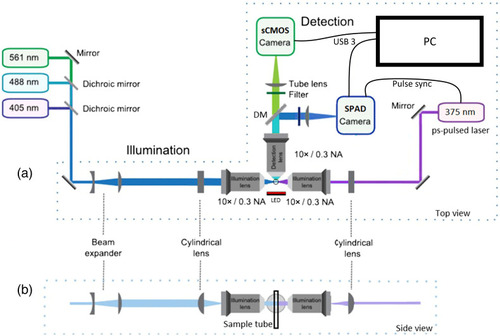
Schematic of the light-sheet FLIM microscope (adapted with permission from Ref. 52). (a) Top view of the SPIM system. The right illumination arm uses a 375 nm ps-pulsed diode laser operated at 50 MHz repetition rate to excite NAD(P)H fluorescence via a 200  μm wide light sheet, while the time-resolved SPAD camera images the NAD(P)H autofluorescence lifetime (after a 495 nm LP DM and a 440/80  nm filter) and the sCMOS camera images the NAD(P)H intensity (using a 530/55  nm filter). The left illumination arm uses a bank of CW lasers to excite other fluorophores via a 1.5 mm wide light sheet, while emissions are imaged on the sCMOS camera. A red LED provides trans-illumination for bright field imaging. (b) Side view of the beams in the illumination arms and the orientation of the sample tube. DM, dichroic mirror.

IRF. To measure the combined IRF of the excitation laser (Omicron QuixX 375-70PS) and the SPAD camera (Horiba FLIMera), a fraction of the excitation laser pulses (50 MHz pulse repetition rate) was directly imaged onto the FLIMera camera by imaging a retroreflector target in an epi-illuminated widefield microscope setup. The 20-ns time axis consists of 486 time bins of 41.1 ps width. The IRF has an FWHM of 380 ps. The DCR of individual pixels can be measured from the non-zero tail of the pixels’ IRF.

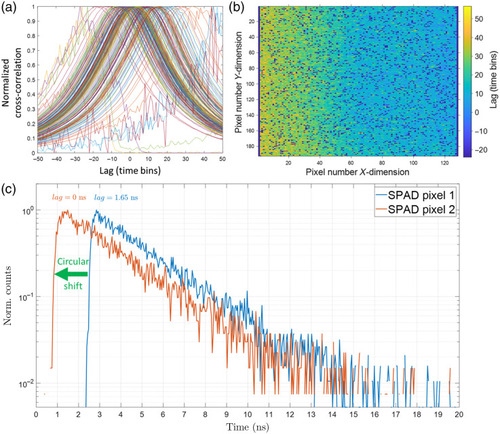
FLIMera SPAD array camera inter-pixel delay map. To compensate for the inter-pixel timing skew and synchronize the rise time of all 192×128  pixels, the normalized cross-correlation of the measured decay for each pixel with a reference decay was calculated. (a) These cross-correlation curves for a representative group of SPAD pixels (each curve is one pixel). The temporal lag value where the normalized cross-correlation is maximized was recorded and mapped as seen in (b) for every pixel of the SPAD array. The “screamer” dead pixels are dark blue and comprise 15% of all pixels. The inter-pixel lag between pixels on the left and right side of the sensor can be as high as 60 time bins (with 41.1 ps time bin width) or 2.5  ns, which is substantial. To synchronize the rise time of all pixels, it suffices to apply an opposite circular shift to the decay histogram of each SPAD pixel by the amount given by the delay map above. (c) The decays from two representative SPAD pixels that have different timing lags. SPAD pixel 1 has a lag of 40 time bins or 1.65 ns with respect to the reference decay, whereas SPAD pixel 2 has a lag of zero. To correct the timing skew, the blue curve should be shifted to the left by 40 time bins.

Fluorescence lifetime fitting of coumarin 6 in ethanol. A saturated solution of coumarin 6 in ethanol was loaded into an FEP sample tube and imaged on the light-sheet SPAD system with 0.4 mW excitation laser power and 3 s integration time using a green emission filter (550/100  nm). (a) The blue curve shows the aggregated decay histogram from all array pixels before correcting for the inter-pixel delays. The red curve shows the aggregated decay histogram after such correction. The corrected decay histogram has a faster rise and higher peak, whereas the uncorrected decay histogram has a slower rise and is temporally broadened. (b) The aggregated decay histogram of all pixels after timing skew correction was fit to a single-exponential decay model using an iterative reconvolution algorithm that performs a least-squares minimization of the residuals. A fluorescence lifetime of 2.51 ns is estimated which agrees with reported published values.6264

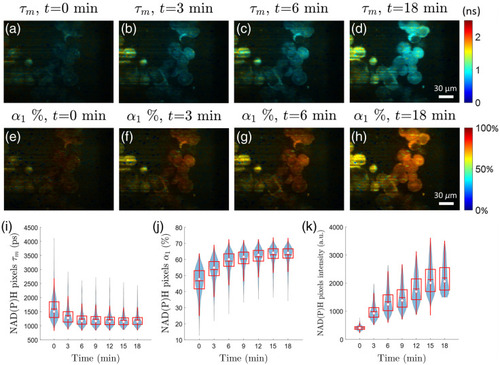
Cyanide treatment of PANC-1 cells confirms the sensitivity of the light-sheet FLIM system to NAD(P)H fluorescence lifetime changes (Video 1, MPEG, 0.5 MB [URL: https://doi.org/10.1117/1.JBO.28.6.066502.s1]). (a)–(d) NAD(P)H mean fluorescence lifetime (τm) images of PANC-1 cells at different time points after treatment with 1 mM sodium cyanide. The sCMOS NAD(P)H intensity image is used to upscale the SPAD array NAD(P)H lifetime image (e)–(h). Corresponding free fraction of NAD(P)H (α1) at the same time points. (i) Boxplot of NAD(P)H τm of image pixels over time shows a rapid drop in mean lifetime within a few minutes of cyanide treatment. (j) NAD(P)H α1 of image pixels increases over time. (k) The pixel intensity of NAD(P)H fluorescence, measured by integrating the decay curve at each pixel in the SPAD camera, increases over time with cyanide exposure. White dot shows the median; red horizontal line shows the mean; box encompasses 25th to 75th percentile range; whiskers extend from the box to 1.5 times the interquartile range. Changes in NAD(P)H mean lifetime (F-statistic = 9.78, p=0.026), free fraction (F-statistic = 21.8, p=0.006), and mean intensity (F-statistic = 113, p=0.0001) with time are significant according to the linear trend test.

Light-sheet imaging of mCherry intensity and NAD(P)H lifetimes in live neutrophils in vivo in a zebrafish caudal fin wound model. (a) The intensity channel of the light-sheet FLIM system shows the superimposed brightfield image of 3 dpf wounded zebrafish tail and light-sheet-excited fluorescence intensity of mCherry+ neutrophils at the wound site (Video 2, MPEG, 2.1 MB [URL: https://doi.org/10.1117/1.JBO.28.6.066502.s2]). The white rectangle shows the corresponding field of view of the smaller SPAD array sensor. (b) NAD(P)H mean fluorescence lifetime (τm) image of the tail (from the SPAD array with 10 s integration). The transection wound (yellow dashed line) and the tip of the notochord (red dashed box) are visible in the lifetime image. (c) Corresponding field of view from the cropped sCMOS image shows mCherry+ neutrophils recruited to the wound site. (d) Pixel mask of neutrophil cells from the mCherry channel applied to the NAD(P)H lifetime image. (e) Masked NAD(P)H lifetime map of the neutrophils.

Acknowledgments
This image is the copyrighted work of the attributed author or publisher, and ZFIN has permission only to display this image to its users. Additional permissions should be obtained from the applicable author or publisher of the image. Full text @ J. Biomed. Opt.