
- Title
-
Significance of Astragaloside IV from the Roots of Astragalus mongholicus as an Acetylcholinesterase Inhibitor-From the Computational and Biomimetic Analyses to the In Vitro and In Vivo Studies of Safety
- Authors
- Stępnik, K., Kukula-Koch, W., Plazinski, W., Gawel, K., Gaweł-Bęben, K., Khurelbat, D., Boguszewska-Czubara, A.
- Source
- Full text @ Int. J. Mol. Sci.
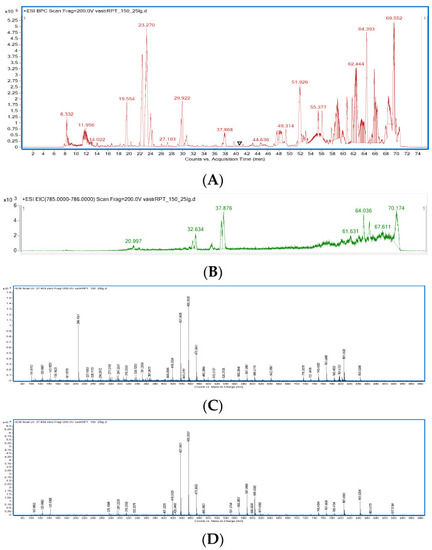
Total ion chromatogram of 50% methanolic extract from the roots of Astragalus mongholicus in the positive ionisation mode (A), extracted ion chromatogram of astragaloside III and IV (m/z of 785) (B), mass spectrum of astragaloside IV (C), mass spectrum of astragaloside III (D). |
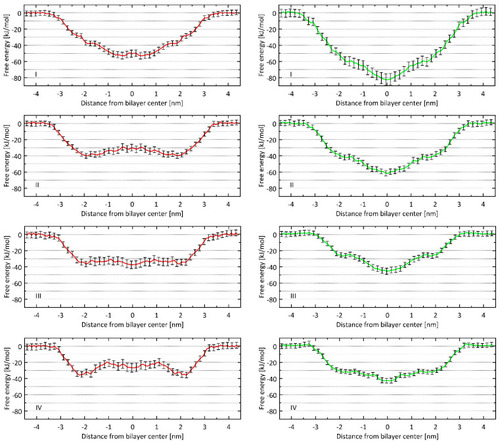
1D free energy profiles associated with the permeability of astragalosides I–IV through the lipid bilayer. Two types of homogeneous bilayers were considered: composed either of POPC (red lines, l-h-s panels) or POPG (green lines, r-h-s panels). The error values (vertical bars) were estimated by the bootstrapping method. |
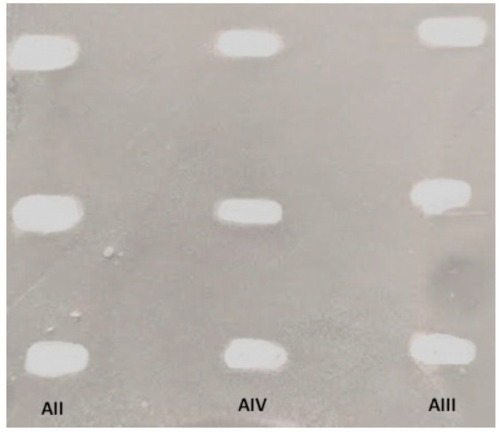
Results of the TLC-bioautography assay for the inhibition of acetylcholinesterase enzyme in daylight on the silica-gel-covered TLC normal phase. The TLC plate shows different concentrations of the tested astragalosides: II (A II), III (A III), and IV (A IV). |
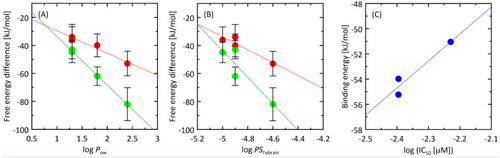
(A) Correlation between the logPow values (taken from [32]) and the smallest value of the free energy profiles associated with the permeability of the studied compounds through the lipid bilayer. The lipid bilayer was composed of either POPC molecules (red points) or POPG molecules (green points). The error bars correspond to the combined bootstrapping errors determined for the smallest value of the energy and the value for the molecule located outside the bilayer. (B) The same as in (A) but the correlation calculated for the logPSFubrain values. (C) Correlation between experimentally-determined IC50 values (recalculated as log(IC50)) and the theoretical ligand-AChE binding energies. |
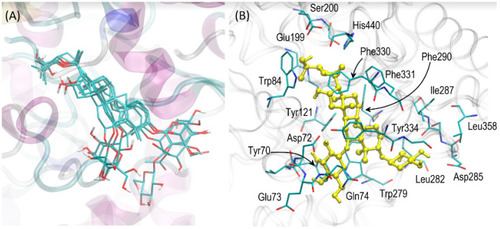
(A) Superposition of the most favourable poses of all ligands interacting with AChE. (B) The most favourable location of the astragaloside IV molecule bound to AChE. The ligand molecule is shown in ball-and-stick representation whereas all the closest amino-acid residues (of the distance not larger than 0.38 nm) are represented by thin sticks. The description of the interaction types is given in the text. The residue numbering is compatible with the PDB:3EVE record. |
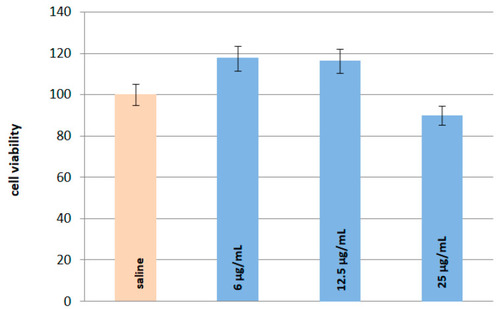
Effect of astragaloside IV (6, 12.5, and 25 μg/mL) on viability of SY-SY5Y human neuroblastoma cells; the histogram shows the mean cellular viability ± SD in comparison with the control saline-treated cells. |
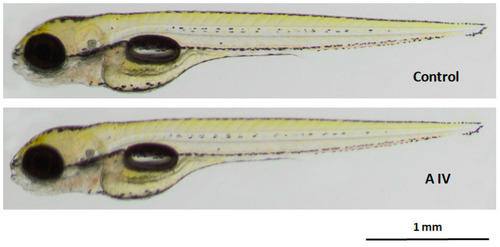
Representative photo of control and astragaloside IV-treated (25 µg/mL) larvae after the 95 h long incubation. The scale bar 1 mm. |