
- Title
-
In a zebrafish biomedical model of human Allan-Herndon-Dudley syndrome impaired MTH signaling leads to decreased neural cell diversity
- Authors
- Silva, N., Campinho, M.A.
- Source
- Full text @ Front Endocrinol (Lausanne)

Expression of MTH-responsive genes reveals 22-31hpf as the developmental time more sensitive to MTH. Zebrafish developmental stages analyzed by qPCR are depicted by camera lucida drawings adapted from (46). Heatmap representation of gene expression levels of sox3, sox19a, sox19b, notch1a, notch1b, her2, her4, dla, dld, jag2a, and neurog1, determined after RT-qPCR in MCT8MO and CTRLMO during embryonic development. Data are represented as fold change of MCT8MO expression relative to the CTRLMO. Statistical differences were evaluated between MCT8MO and CTRLMO for each time point using a t-test after normal distribution was confirmed (D’Agostino & Pearson test). N = 8 (*p<0.05; **p<0.01). |

Compromised number and distribution of HuC/D neurons in MCT8MO embryos at specific stages of development. (A) Representative maximum projection images of the pan-neuronal marker HuC/D immunostaining (white) in the spinal cord between somite 8-12. Comparison of the pattern of neuron distribution in the spinal cord between CTRLMO and MCT8MO embryos at different stages of development. Red highlight - dorsal views, anterior spinal cord up. Blue highlight - lateral view, anterior spinal cord right. Green highlight -transversal view, dorsal spinal cord up. Scale bars represent 25 µm. (B) Quantification of the number of HuC/D single positive cells in a 2-myotome length of the spinal cord. n=9-17. CTRL (CTRLMO); MO (MCT8MO). Results are presented as mean ± SD; Statistical significance determined by t-test: two-sample, assuming equal variances: *p<0.05; ***p<0.001. |

MCT8MO embryos have altered glial cell development during early neurogenesis. (A) Representative maximum intensity projection images of the spinal cord between somite 8-12 after glial cell labelling with ZRF-1 immunostaining (white, labelling GFAP fibers). In control embryos, at 15hpf glial cell fibers are organized in the developing ventral spinal cord; in MCT8MO embryos, the development of these cells is delayed, and only some scattered GFAP fibers are detected in the ventral-most neural tube. At 22hpf, the neural tube is closed, and glial cells can be detected throughout the spinal cord of CTRLMO and MCT8MO embryos; at 25hpf, the patterning of glial cells is altered in MCT8MO embryos. Red highlight - dorsal views, anterior spinal cord up. Blue highlight - lateral view, anterior spinal cord right. Green highlight - transversal view dorsal spinal cord up. All scale bars represent 25 µm. Dashed yellow lines denote spinal cord boundaries. (B) Quantification of the area of GFAP staining in a 2-myotome length of the spinal cord. n=9-17. CTRL (CTRLMO); MO (MCT8MO). Results are presented as mean ± SD; Statistical significance determined by t-test: two-sample, assuming equal variances: **p<0.01. |
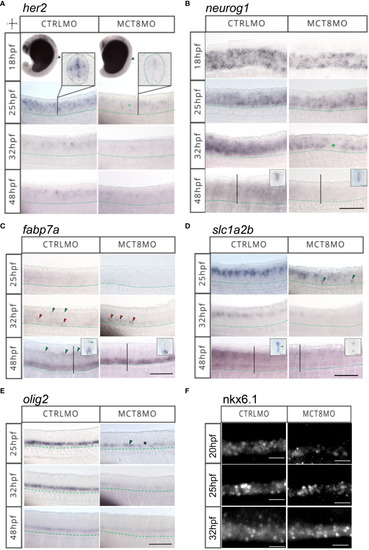
MTH is necessary for developing and correctly positioning neural cells in the spinal cord. WISH expression pattern of (A)her2, (B)neurog1, (C)fabp7a, (D)slc1a2b, (E)olig2, (F) IHC for Nkx6.1 in the spinal cord (SC) of zebrafish during embryonic development in MCT8MO and CTRLMO embryos. (A) Green asterisk in 25hpf MCT8MO represents absence of her2 expression. (B) Green asterisk in 32hpf MCT8MO highlights absence of neurog1 expression. (C) Green arrowheads at 32hpf CTRLMO, indicate the dorsal fabp7a+ cells which are lost in MCT8MO. Red arrowheads indicate increased fabp7a staining in the ventral domain in MCT8MO. At 48hpf, green arrowheads indicate fabp7a+ cells in the CTRLMO SC dorsal domain, which are less evident in MCT8MO. (D) At 25hpf, green arrowheads indicate misplaced slc1a2b+ cells in the ventral SC of MCT8MO. At 32hpf, the expression of slc1a2b is less abundant in MCT8MO. At 48hpf MCT8MO display reduced slc1a2b signal in cells at the most ventral and dorsal regions of the neurocoelom. The green arrowhead in the CTRLMO inset indicates an area where slc1a2b expression is less abundant in MCT8MO. (E) In CTRLMO, olig2+ cells were present in the most ventral region of the SC. At 25hpf, the green arrowhead indicates the position of olig2+ cell clusters, and the asterisk denotes the absence of cells in MCT8MO. |
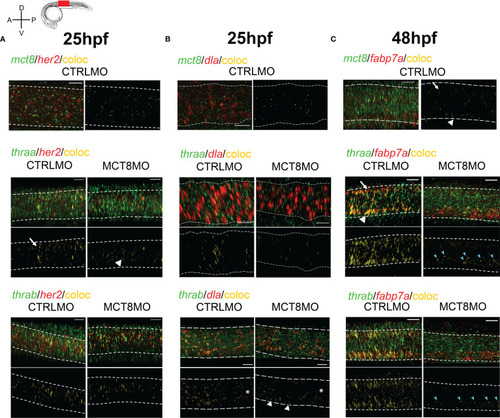
MTH is directly involved in the development of discrete her2, dla, and fabp7a cells. Colocalization of zebrafish thraa, thrab, and mct8 with her2 and dla expressing cells at after double WISH. thraa, thrab and mct8 (green); her2, dla and fabp7a (red) and colocalization (yellow). (A) At 25hpf, thraa/her2 colocalization in CTRLMO embryos (arrow) is increased in the apical spinal cord, while in MCT8MO thraa/her2 colocalization has a more medial distribution in the spinal cord (arrowhead). (B) At 25hpf, thrab/dla colocalization is less predominant in MCT8MO embryos, and asterisks denote decreased colocalization along the anterior-posterior axis of the spinal cord. Arrowheads indicate the increased colocalization of thrab/dla+ in cells of the ventral spinal cord in MCT8MO embryos. (C) At 48hpf, mct8/fabp7a colocalization in CTRLMO occurs scattered through the spinal cord with an arrow indicating colocalization in the dorsal spinal cord and arrowhead colocalization in the ventral spinal cord. Colocalization of fabp7a with thraa and thrab in MCT8MO embryos is more restricted to the ventrally located fabp7a+ cells (blue arrowheads). All images depict a spinal cord section between somite 8-12; rostral is left and dorsal up. White dashed lines show the boundary of the spinal cord. A minimum of 3 individuals/conditions was analyzed. The scale bar represents 20µm. |
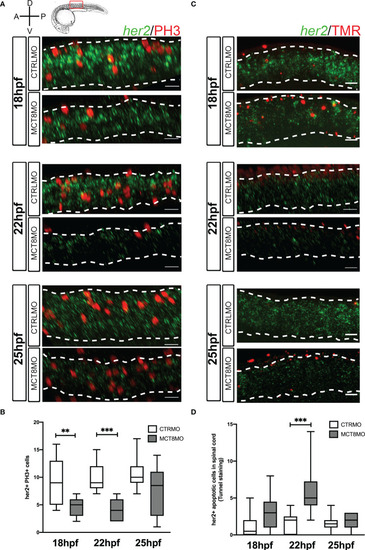
Impaired MTH signaling decreases her2+ neural progenitor cells undergoing mitosis in the spinal cord. (A) Analysis of her2 expression by fluorescent in situ hybridization (green) and mitotic cells (phosphohistone 3 antibody; red) in CTRLMO) and MCT8MO embryos. (B) Box-and-whiskers plot depicting quantification of the number of her2+ mitotic cells (her2+/PH3+) in the spinal cord at 18, 22, and 25hpf. (C) Analysis of her2 expression by fluorescent in situ hybridization (green) and colocalization with apoptotic cell detected using a TUNEL assay (red). (D) Box-and-whiskers plot depicting the quantification of the number of her2+ apoptotic cells in the spinal cord. The images represent a lateral view of the spinal cord between somite 8-12; rostral is to the left in all images; the scale bar represents 50 µm. Colocalization was quantified in the volume of 2 myotomes within this spinal cord region. n=10-15. Statistical significance determined by t-test: two-sample, assuming equal variances. **p<0.01; *** p<0.001. |

Impaired MTH signaling affects proliferation and apoptosis of dla+ spinal cord cells in a time-restricted manner. (A) Analysis of dla expression by fluorescent in situ hybridization (green) and colocalization with cell mitosis (phosphohistone 3 immunostaining, red) in CTRLMO) andMCT8MO embryos. (B) – Box-and-whiskers plot of quantification of the number of dla+ mitotic cells in the spinal cord at 18, 22, and 25hpf in control and MCT8MO injected embryos. (C) Analysis of dla expression by fluorescent in situ hybridization (green) and colocalization with apoptotic cell detected using a TUNEL assay (red). (D) Box-and-whiskers plot quantifying the number of dla+ apoptotic cells in the spinal cord at 18, 22, and 25hpf in control and MCT8MO injected embryos. The images present a lateral view of the spinal cord between somite 8-12, rostral is to the left, and dorsal up in all images. The scale bar represents 50 µm. Colocalization was analyzed in 2 myotome volume sections within this spinal cord region (n=10-15). Statistical significance determined by t-test: two-sample, assuming equal variances. **p<0.01. |

Effect of impaired MTH signaling and NICD overexpression on progenitor cell division. (A) At the start of imaging, representative images of the spinal cord of experimental Tg(elav3:LY-mCherry) embryos at 23hpf. Neurons (mCherry) are shown in white. Embryos were injected at the one-cell stage with either CTRLMO or MCT8MO followed by injection at the 16-cell stage in one blastomere with gfp mRNA only or nicd and gfp mRNA. Cells overexpressing NICD (and GFP) are labelled in magenta. Dorsal views of single slices between somite 8-15 are shown, anterior spinal cord up. The scale bar represents 50 µm. (B) Upper panel: Detail of symmetric division originating 2 morphologically similar GFP+ cells. A cell undergoing symmetric mitosis (yellow arrow), and the originating daughter cells (yellow arrowheads); Lower panel: Representative images of asymmetric division. A dividing cell (yellow arrow) originates two daughter cells (yellow arrowheads). Scale bar in B represent 20 µm. In all panels, the spinal cord basal limit is indicated by a dashed yellow line and the pial limit by dotted yellow lines. (C–F) (C) Percentage of analyzed GFP+ cells that underwent division. (D) Distribution of GFP+ dividing cells relative to all GFP+ cells observed in the period from 23-26hpf. χ2 analysis showed differences in the distribution of the number of cells undergoing symmetric or asymmetric divisions amongst experimental groups and CTRLMO (p<0.05). (E) Percentage of a cell undergoing symmetric division. (F) Percentage of cells undergoing asymmetric division. The results in C, D, and F are presented as the mean ± SD; results in D depict the ratio of cell division type in all GFP+ dividing cells analyzed. N =5-6 individuals per group (number of cells evaluated by group: CTRLMO/GFP=56; MCT8MO/GFP=77; CTRLMO/NICD/GFP=93; MCT8MO/NICD/GFP=46); Statistical significance in (C, E, F) was determined by a one-way ANOVA followed by a Holm-Sidak’s multiple comparison post hoc analysis, *p<0.05, **p<0.01, ***p<0.001. |