
- Title
-
kcna1a mutant zebrafish model episodic ataxia type 1 (EA1) with epilepsy and respond to first-line therapy carbamazepine
- Authors
- Dogra, D., Meza-Santoscoy, P.L., Gavrilovici, C., Rehak, R., de la Hoz, C.L.R., Ibhazehiebo, K., Rho, J.M., Kurrasch, D.M.
- Source
- Full text @ Epilepsia
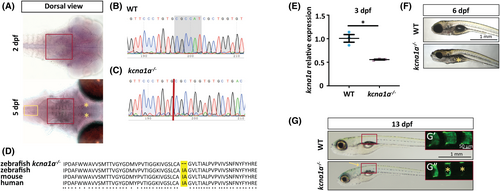
Expression analysis of kcna1a and generation of kcna1a−/− zebrafish model using CRISPR/Cas9 technique. (A) In situ hybridization for kcna1a expression at 2 dpf and 5 dpf. Red boxes indicate RNA probe signal in M cells in hindbrain at 2 dpf and 5 dpf. Yellow asterisks indicate RNA probe signal in nMLF in midbrain at 5 dpf. Yellow box indicates RNA probe signal in the neurons present in the spinal cord at 5 dpf. (B, C) Nucleotide sequences of kcna1a in zebrafish WT and kcna1a−/−. Gray highlighted region indicates the six nucleotides deleted due to mutation in kcna1a−/−. (D) Amino acid sequence of Kcna1a in zebrafish kcna1a−/− and WT, and orthologues in mouse (KCNA1) and human (KCNA1). Yellow highlighted region indicates two amino acid deletions due to mutation in kcna1a−/−. (E) qPCR analysis for relative kcna1a mRNA expression in 3 dpf kcna1a−/− larvae compared to WT. WT and kcna1a−/−, n = 3 × 10 larvae assessed as three biological and two technical replicates each. kcna1a is downregulated in kcna1a−/− indicating active mRNA degradation. (F) WT and kcna1a−/− larvae at 6 dpf. Yellow asterisk indicates absence of swim bladder in kcna1a−/− larvae. (G, G′, G″) WT and kcna1a−/− larvae at 13 dpf. Yellow arrow points to spinal curvature progression in kcna1a−/− larvae. Red boxes outline the trunk regions with alizarin red stained vertebral segments (G′, G″). Yellow asterisks indicate missing or deformed vertebral segments in kcna1a−/− larvae. Scale bars = 1 mm, 50 μm. Data are mean ± SEM, *p ≤ .05- Unpaired t test. dpf, days post fertilization; M cells, Mauthner cells; nMLF, nucleus of the medial longitudinal fasciculus; WT, wild-type. |
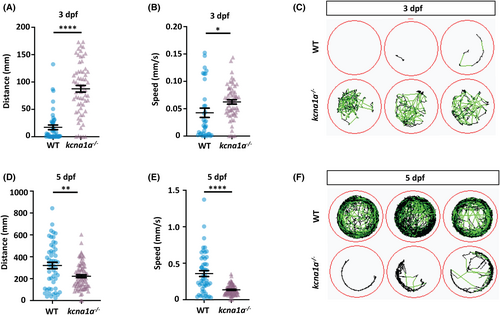
Spontaneous behavior analysis of kcna1a−/− zebrafish. (A) Quantification of distance traveled at 3 dpf tracked in 100% light for 30 min. kcna1a−/− move higher distances compared to WT. WT, n = 44; kcna1a−/−, n = 63. (B) Quantification of speed at 3 dpf tracked in 100% light for 30 min. Speed of kcna1a−/− is significantly higher than WT. WT, n = 34; kcna1a−/−, n = 60. (C) Locomotor plots at 3 dpf, showing that kcna1a−/− are more active than WTs. WT, n = 20; kcna1a−/−, n = 20. (D) Quantification of distance traveled at 5 dpf tracked in 100% light for 30 min. Distance traveled by kcna1a−/− is significantly reduced compared to WT. WT, n = 51; kcna1a−/−, n = 84. (E) Quantification of speed at 5 dpf tracked in 100% light for 30 min. Speed of kcna1a−/− is significantly reduced compared to WT. WT, n = 50; kcna1a−/−, n = 84. (F) Locomotor plots at 5 dpf, showing that kcna1a−/− are moving less and have abnormal swimming patterns. WT, n = 20; kcna1a−/−, n = 24. Data are mean ± SEM, *p ≤ .05, **p ≤ .01, ****p ≤ .0001- Unpaired t test |
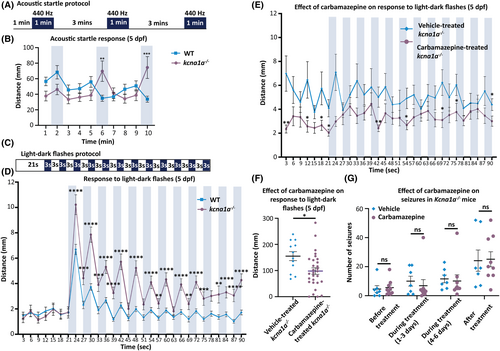
Analysis of startle response in kcna1a−/− zebrafish and effect of carbamazepine treatment on kcna1a−/− zebrafish and Kcna1a−/− mice. (A) Schematic representation of acoustic startle protocol. (B) Quantification of distance traveled every 1 min in acoustic startle at 5 dpf. kcna1a−/− are more responsive to startle with significantly higher distance traveled in second and third vibration pulse compared to WT. WT, n = 113; kcna1a−/−, n = 52. (C) Schematic representation of light–dark flashes protocol. (D) Quantification of distance traveled every 3 s in light–dark flashes at 5 dpf. kcna1a−/− show higher sensitivity to startle with more distance traveled compared to WT. WT, n = 108; kcna1a−/−, n = 63. (E, F) Quantification of distance traveled every 3 s (E) and in 90 s (F) in light–dark flashes after treatment with carbamazepine at 5 dpf. Carbamazepine treatment rescues impaired startle response in kcna1a−/−. Vehicle-treated kcna1a−/−, n = 12; carbamazepine-treated kcna1a−/−, n = 29. (G) Quantification of number of seizures encountered by vehicle- and carbamazepine-treated P36-38 Kcna1a−/− mice at different time points. Carbamazepine treatment does not reduce the frequency of seizures in Kcna1a−/− mice. Vehicle-treated Kcna1a−/−, n = 7; carbamazepine-treated Kcna1a−/−, n = 9. Data are mean ± SEM, ns: no significant changes observed, *p ≤ .05, **p ≤ .01, ***p ≤ .001, ****p ≤ .0001- Unpaired t test. |
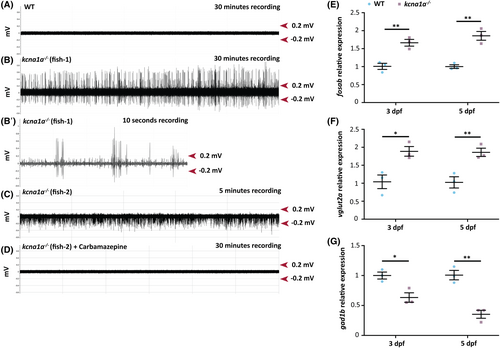
Brain hyperexcitability and E/I imbalance analysis in kcna1a−/− zebrafish. (A, B, B′) Representative extracellular field recordings obtained from the optic tectum of 3 dpf WT (A) and kcna1a−/− zebrafish larvae (B, B′- higher magnification of B). WTs show no evidence of abnormal electrical activity. The repetitive inter-ictal like discharges with high-frequency large amplitude spikes (1.6 ± 0.5 Hz; 0.4 ± 0.1 mV) seen in the kcna1a−/− are indicative of increased network hyperexcitability. WT, n = 7 out of 7 with no abnormal activity; kcna1a−/−, n = 5 out of 8 show epileptiform activity. (C, D) Representative extracellular recordings obtained from optic tectum of 3 dpf kcna1a−/− zebrafish larvae before (C) and after treatment with carbamazepine (D). Carbamazepine treatment leads to the reversal of epileptiform activity of kcna1a−/−. kcna1a−/−, n = 3 out of 3 have their hyperexcitability rescued by carbamazepine. (E–G) qPCR analysis for relative fosab, vglut2a, and gad1b mRNA expression in 3 dpf and 5 dpf kcna1a−/− larvae compared to WT. WT and kcna1a−/−, n = 3 × 10 larvae assessed as three biological and two technical replicates each. fosab is upregulated in kcna1a−/− indicating brain hyperexcitability. vglut2a is upregulated and gad1b is downregulated in kcna1a−/− indicating dysfunctional E/I balance. Data are mean ± SEM, ns: no significant changes observed, *p ≤ .05, **p ≤ .01- Unpaired t test. |
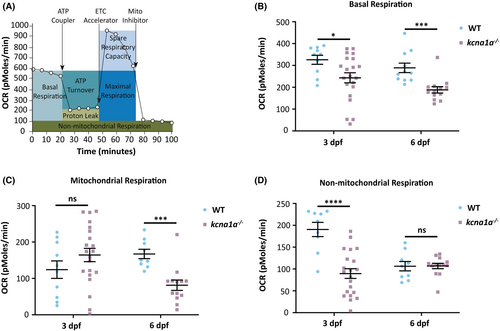
Metabolic characterization of kcna1a−/− zebrafish. (A) Schematic representation of how the Seahorse bioanalyser displays mitochondria bioenergetics as regulated by pharmacological inhibitors. (B) Quantification of basal respiration. kcna1a−/− exhibit a significant reduction in basal respiration compared to WT at 3 dpf and 6 dpf. WT, n = 10; kcna1a−/−, n = 21 at 3 dpf. WT, n = 11; kcna1a−/−, n = 13 at 6 dpf. (C) Quantification of mitochondrial respiration. kcna1a−/− exhibit a significant reduction in mitochondrial respiration compared to WT at 6 dpf. WT, n = 10; kcna1a−/−, n = 21 at 3 dpf. WT, n = 9; kcna1a−/−, n = 13 at 6 dpf. (D) Quantification of non-mitochondrial respiration. kcna1a−/− exhibit a significant reduction in non-mitochondrial respiration compared to WT at 3 dpf. WT, n = 19; kcna1a−/−, n = 21 at 3 dpf. WT, n = 9; kcna1a−/−, n = 13 at 6 dpf. Data are mean ± SEM, ns: no significant changes observed, *p ≤ .05, ***p ≤ .001, ****p ≤ .0001- Unpaired t test. OCR, oxygen consumption rate. |