
|
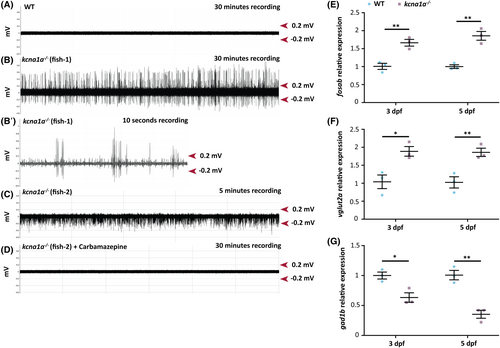
Fig. 4 Brain hyperexcitability and E/I imbalance analysis in kcna1a−/− zebrafish. (A, B, B′) Representative extracellular field recordings obtained from the optic tectum of 3 dpf WT (A) and kcna1a−/− zebrafish larvae (B, B′- higher magnification of B). WTs show no evidence of abnormal electrical activity. The repetitive inter-ictal like discharges with high-frequency large amplitude spikes (1.6 ± 0.5 Hz; 0.4 ± 0.1 mV) seen in the kcna1a−/− are indicative of increased network hyperexcitability. WT, n = 7 out of 7 with no abnormal activity; kcna1a−/−, n = 5 out of 8 show epileptiform activity. (C, D) Representative extracellular recordings obtained from optic tectum of 3 dpf kcna1a−/− zebrafish larvae before (C) and after treatment with carbamazepine (D). Carbamazepine treatment leads to the reversal of epileptiform activity of kcna1a−/−. kcna1a−/−, n = 3 out of 3 have their hyperexcitability rescued by carbamazepine. (E–G) qPCR analysis for relative fosab, vglut2a, and gad1b mRNA expression in 3 dpf and 5 dpf kcna1a−/− larvae compared to WT. WT and kcna1a−/−, n = 3 × 10 larvae assessed as three biological and two technical replicates each. fosab is upregulated in kcna1a−/− indicating brain hyperexcitability. vglut2a is upregulated and gad1b is downregulated in kcna1a−/− indicating dysfunctional E/I balance. Data are mean ± SEM, ns: no significant changes observed, *p ≤ .05, **p ≤ .01- Unpaired t test.