
- Title
-
Aspergillus fumigatus transcription factor ZfpA regulates hyphal development and alters susceptibility to antifungals and neutrophil killing during infection
- Authors
- Schoen, T.J., Calise, D.G., Bok, J.W., Giese, M.A., Nwagwu, C.D., Zarnowski, R., Andes, D., Huttenlocher, A., Keller, N.P.
- Source
- Full text @ PLoS Pathog.

ZfpA impacts virulence in wild-type but not neutrophil-deficient hosts.
Survival analysis of larvae with the dominant negative Rac2D57N neutrophil mutation (neutrophil-deficient) or wild-type siblings injected with PBS, WT CEA10, ΔzfpA, or OE::zfpA strains. WT larvae average spore dose injected: WT CEA10 = 60, ΔzfpA = 50, OE::zfpA = 62. Rac2D57N larvae average spore dose injected: WT CEA10 = 52, ΔzfpA = 54, OE::zfpA = 53. Results represent pooled data from 3 independent replicates. n = 71–72 larvae per condition. p values and hazard ratios calculated by Cox proportional hazard regression analysis. |

ZfpA controls fungal burden but does not affect immune cell recruitment in wild-type hosts.
2-day post fertilization wild-type larvae with fluorescent macrophages (GFP) and neutrophils (BFP) were infected with RFP-expressing WT CEA10, ΔzfpA, or OE::zfpA strains. Larvae were imaged with confocal microscopy at 24, 48, 72, and 96 hours post infection (hpi). (A) Representative images of fungal growth and immune cell recruitment in the same larva at 24–96 hpi. Images represent maximum intensity projections of z-stacks. Scale bar = 50 μm. (B) Mean percentage of larvae with germinated spores at 24–96 hpi. Dots and error bars represent mean+s.d. (C) 2D fungal (RFP) area at 24–96 hpi. (D) 2D neutrophil (BFP) area 24–96 hpi. (E) 2D macrophage (GFP) area at 24–96 hpi. Bars in (C-E) represent lsmeans+s.e.m. Results represent data pooled from 4 independent experiments. n = 45–48 larvae per condition. p values calculated by ANOVA with Tukey’s multiple comparisons. *p<0.05, **p<0.01. |
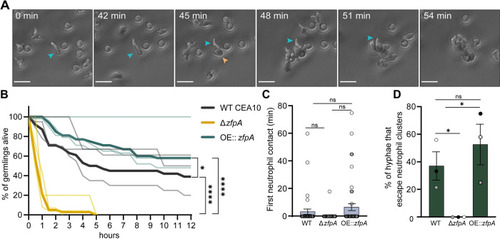
ZfpA promotes resistance to neutrophil killing.
Outcomes of human neutrophil interactions with WT CEA10, ΔzfpA, and OE::zfpA following 12 h of co-incubation. Neutrophils were added to A. fumigatus germlings (neutrophil:spore 100:1) in 24-well plates and images were acquired every 3 min for 12 h. (A) Representative images of neutrophils detecting and tightly clustering around an A. fumigatus (OE::zfpA) germling within the first hour of co-incubation. Blue arrow indicates visible germling. Orange arrow indicates first neutrophil contact. Scale bar = 20 μm. (B) Percent of germlings alive determined by presence of cytoplasmic RFP signal at 30 min intervals over 12 h. Thin lines represent data from 3 independent experiments, thick lines represent pooled data. n = 38–47 germlings per strain. p values calculated by Cox proportional hazard regression analysis. (C) Time of first neutrophil contact with germling. Dots represent individual germlings color coded by replicate and bars represent mean±s.e.m. Statistical comparisons calculated by t-tests. (D) Percent of germlings able to “escape” neutrophil contact by extending hyphae outside of surrounding neutrophil clusters. Bars represent mean ±s.e.m. Dots represent independent experiments. p values calculated by t-tests. *p<0.05, ****p<0.0001. |

ZfpA has minimal impact on neutrophil effector functions or fungal susceptibility to phagocytic ROS.
(A) Neutrophil extracellular trap formation in response to WT CEA10, ΔzfpA, and OE::zfpA hyphae after 6 h of co-incubation (neutrophil:spore 2:1). Bars represent mean±s.e.m. of relative fluorescent units (RFU) of Sytox Green signal from 3 independent experiments (dots). (B) ELISA quantification of IL-8 production by neutrophils in response to WT CEA10, ΔzfpA, and OE::zfpA hyphae after 3 h of co-incubation (neutrophil:spore 2:1). Bars represent mean±s.e.m. from 3 independent experiments (dots). (C) ELISA quantification of myeloperoxidase release by neutrophils in response to WT CEA10, ΔzfpA, and OE::zfpA hyphae after 3 h of co-incubation (neutrophil:spore 2:1). Bars represent mean±s.e.m. from 3 independent experiments (dots). Statistical comparisons calculated by t-tests. (D) Survival analysis of PHOX-deficient larvae or wild-type siblings injected with PBS, WT CEA10, ΔzfpA, or OE::zfpA strains. p22+/+ larvae average spore dose injected: WT CEA10 = 45, ΔzfpA = 40, OE::zfpA = 42. p22-/- larvae average spore dose injected: WT CEA10 = 35, ΔzfpA = 41, OE::zfpA = 31. Results represent pooled data from 3 independent replicates. n = 45–59 larvae per condition. p values and hazard ratios calculated by Cox proportional hazard regression analysis. |

ZfpA alters resistance to cell wall perturbation but not osmotic or oxidative stressors.
Spot-dilution assays to test susceptibility of ZfpA mutants to the cell wall stressor calcofluor white (CFW), osmotic stressor sorbitol, or the oxidative stressor H2O2. Spores were point-inoculated on solid glucose minimal medium (GMM) ± stressors at concentrations of 105−102 and incubated for 48 hours at 37°C. Images are representative of growth from 3 plates per condition. |

ZfpA overexpression decreases voriconazole efficacy in vitro and during infection.
(A) Susceptibility of WT CEA10, ΔzfpA, and OE::zfpA to 0.1 and 0.25 μg/ml voriconazole (VOR). 104 spores were point-inoculated on solid GMM with voriconazole or DMSO. Bars represent mean±s.d. of relative colony diameter of 4 plates per condition. p values calculated by ANOVA with Tukey’s multiple comparisons. ***p<0.001, ****p<0.0001. (B) Survival analysis of infected Rac2D57N larvae (neutrophil-deficient) bathed in 0.1 μg/ml voriconazole or 0.001% DMSO. Average spore dose injected: WT CEA10 = 39, ΔzfpA = 35, OE::zfpA = 37. Results represent pooled data from 3 independent experiments. n = 44–66 larvae per condition. p values and hazard ratios calculated by Cox proportional hazard regression analysis. |

ZfpA mediates echinocandin tolerance by altering developmental chitin synthesis.
(A) Susceptibility of WT CEA10, ΔzfpA, and OE::zfpA to 0.25, 0.5, 1, and 8 μg/ml caspofungin (CSP). 104 spores were point-inoculated on solid GMM with caspofungin or DMSO. Bars represent mean±s.d. of colony diameter at 4 days post inoculation of 4 plates per condition. (B) Susceptibility of WT CEA10, ΔzfpA, and OE::zfpA to 0.25, 0.5, 1, and 8 μg/ml micafungin (MCF). 104 spores were point-inoculated on solid GMM with micafungin or DMSO. Bars represent mean±s.d. of colony diameter at 4 days post inoculation of 4 plates per condition. p values calculated by ANOVA with Tukey’s multiple comparisons. (C) Images represent calcofluor white (CFW) staining of WT CEA10, ΔzfpA, and OE::zfpA following overnight exposure to 1 μg/mL caspofungin (CSP) or DMSO. CFW staining is represented by cyan and cytoplasmic RFP signal is shown in magenta. Scale bar = 50 μm. (D) Mean gray value of CFW signal following DMSO or caspofungin treatment. Bars represent mean±s.e.m of 3 independent experiments. n = 24–30 hyphae per condition. (E) Experimental setup for chitin stimulation with CaCl2/CFW. Spores were incubated for 8 h at 37°C or until germination in liquid GMM or liquid GMM supplemented with 0.2 M CaCl2 and 100 μg/mL CFW. After germination, media was replaced for GMM + 1 μg/mL caspofungin or DMSO and hyphae were incubated for an additional 12 h before detecting PrestoBlue viability reagent signal in a plate reader. (F) Bars represent mean±s.d. of relative fungal viability following caspofungin exposure. Relative viability was calculated by normalizing the mean signal of caspofungin-treated wells to the mean signal of DMSO-treated wells. All experiments included 5 wells/condition. Data are pooled from 3 independent experiments. p values calculated by ANOVA with Sidak’s multiple comparisons. *p<0.05, **p<0.01, ***p<0.001, ****p<0.0001. |

ZfpA alters susceptibility to caspofungin during infection.
Survival analysis of Rac2D57N larvae (neutrophil-deficient) infected with WT CEA10, ΔzfpA, or OE::zfpA strains and bathed in 1 μg/mL caspofungin (CSP) or 0.01% DMSO. Average spore dose injected: WT CEA10 = 35, ΔzfpA = 30, OE::zfpA = 40. Results represent pooled data from 3 independent experiments. n = 50–59 larvae per condition. p values and hazard ratios calculated by Cox proportional hazard regression analysis. |