
- Title
-
vwa1 Knockout in Zebrafish Causes Abnormal Craniofacial Chondrogenesis by Regulating FGF Pathway
- Authors
- Niu, X., Zhang, F., Ping, L., Wang, Y., Zhang, B., Wang, J., Chen, X.
- Source
- Full text @ Genes (Basel)
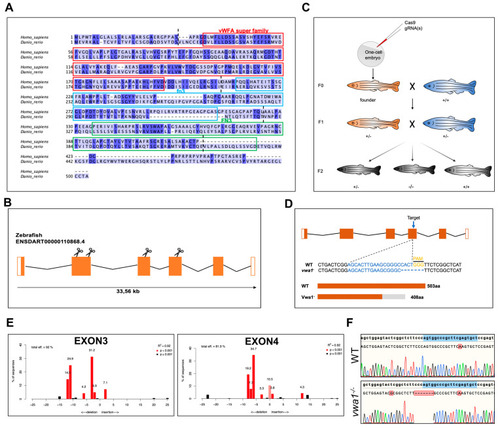
Conservation of vwa1 across species and generation of vwa1 knockout zebrafish by CRISPR/Cas9 genome editing. (A) Multiple sequence alignment of amino acids for human (445 aa) and zebrafish (503 aa) VWA1. Identical amino acids are shaded blue. The von Willebrand factor A-domain (vWFA), first fibronectin type III repeat domain (fn3), and second fibronectin type III repeat domain (FN3) are marked with red, blue, and green boxes, respectively. The boundaries between exons are marked with black dashed lines. (B) Structure of exons and introns of zebrafish vwa1. Untranslated regions are represented by white boxes, and coding regions are represented by orange boxes. Scissors indicate the position of the four CRISPR guides used to generate vwa1-KO crispants. (C) Stepwise construction of mutants. Adult F0 zebrafish were outcrossed with WT zebrafish, and their offspring were genotyped by PCR and Sanger sequencing to identify germline transmission of the vwa1 deletion (F0 founders). A selected F0 founder was then crossed with WT zebrafish to obtain F1 heterozygotes, which were inbred to obtain F2 homozygous mutants. (D) Detailed illustration of mutant line generated by targeting exon 4. (E) Validation of the efficiency of gRNAs. Validation of the second gRNA targeting exon 2 failed owing to its intron-adjacent location. (F) Schematic diagram and sequencing results for WT controls and the vwa1 mutant line in the F2 generation generated by CRISPR/Cas9 technology. Lower panel shows the target sequence (blue), protospacer adjacent motif (PAM) sequence (yellow), and 7-bp deletion in the mutant line. |

vwa1 knockout in zebrafish causes craniofacial defects. (A) General phenotypic changes in F0 mosaic and F2 homozygous embryos. Morphology was assessed at 5 dpf; un-injected WT larvae were used as controls (WT). Black arrow, lower jaw underdevelopment. Blue arrow: altered swim bladder development. Red arrow: pericardial edema. (B) Cartilage formation at 5 dpf, detected by Alcian Blue staining. Compared to controls, F0 crispants and F2 homozygous larvae showed hypoplastic Meckel’s cartilage and palatoquadrate, a significantly widened angle between ceratohyals, and a reduction in the number of hypoplastic ceratobranchial cartilages. m, Meckel’s cartilage; pq, palatoquadrate; cb, ceratobranchial; ch, ceratohyal; hs, hyosymplectic. (C) RT-qPCR analysis of vwa1 expression levels in F0 crispants and the −7 bp deletion mutant line at 5 dpf. n = 3 independent experiments. * p < 0.05; ** p < 0.01. |
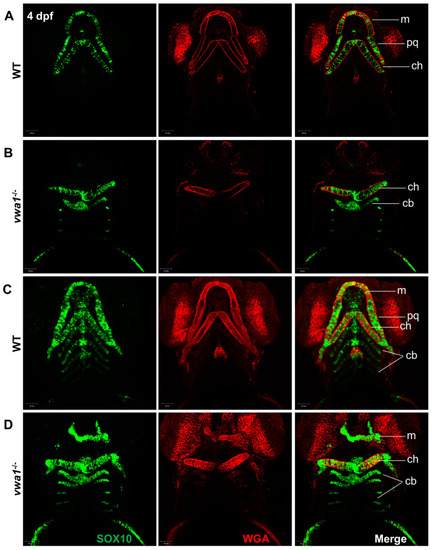
Immunofluorescence assay of WGA and SOX10 reveals a disorganized arrangement of chondrocytes in mutant embryos. (A,B) A WT control embryo at 4 dpf, with single-layer images (A) showing normal craniofacial cartilage morphogenesis and stacked images (B) showing the characteristic “stack of pennies” arrangement of cartilage cells in which the slender cartilage cells assembled with each other to form their own cartilage elements. (C,D) Compared with the WT control group, (C) single-layer and (D) stacked images showed deformities in the overall morphology of the mandibular cartilage of vwa1 mutants, a near absence of Meckel’s cartilage and palatal square cartilage, severely deformed ceratohyal, and smaller size and aspect ratio of many chondrocytes. m, Meckel’s cartilage; pq, palatoquadrate; cb, ceratobranchial; ch, ceratohyal. |

vwa1 functions in cranial neural crest cell condensation. (A) WISH analysis of crestin at 24 hpf showed no significant difference between vwa1 mutants and WT controls. (B) The expression pattern of dlx2a and tbx1 were essentially normal in the pharyngeal arch at 30 hpf, although the absolute area was smaller owing to the reduced body size of mutants. (C) At 48 hpf, expression of the endodermal pouch marker, nkx2.3, was not significantly different between mutant embryos and WT controls. However, the expression of barx1, indicative of the condensation of prechondral mesenchymal cells, was significantly reduced in the pharyngeal region of vwa1 mutants compared with that in WT controls. (D) Expression level of sox9a did not change significantly at 60 hpf, whereas the expression of col2a1a decreased at 72 hpf. The mandibular region is marked with dotted blue circles. |

Increased apoptosis and decreased proliferation of cranial neural crest cell in vwa1 mutant embryos. (A,B) TUNEL staining (red fluorescence) revealed increased cell apoptosis in the cranial region and dorsal tissues of vwa1 mutant embryos at 24 hpf. SOX10 marked CNCCs. (C,D) PHH3 staining (red fluorescence) showed decreased cell proliferation in the cranial region of vwa1 mutant embryos at 30 hpf. SOX10 marked CNCCs. The pharyngeal arches are marked with dotted white circles. * p < 0.05; *** p < 0.001. |

vwa1 regulates FGF signaling in the pharyngeal region. (A) RT-qPCR analysis of the mRNA levels of fgf8a, fgf8b, fgfr1, fgfr2, fgfr3, fgfr4, runx2a, barx1, and col2a1a in vwa1−/− zebrafish, showing that all of these FGF signaling pathway components except for fgf8b were decreased in vwa1 mutants. Relative transcription levels were calculated as fold change using the 2−ΔΔCt method. (B) WISH staining of fgf8a, fgfr2, and fgfr3 in vwa1 mutant embryos and WT controls showed that fgf8a, fgfr2, and fgfr3 expression were all reduced in mutant embryos. The mandibular region is marked with dotted blue circles. Figure S2 Apoptosis did not significantly increase in vwa1−/− mutants at 30 and 48 hpf. (A,B) TUNEL assay (red fluorescence) at 30 hpf demonstrated similar amount of apoptosis cells in the cranial region and dorsal tissues of wildtype controls (WT) and mutants. (C,D) TUNEL assay (red fluorescence) at 48 hpf showed similar level of apoptosis in WT and mutants. * p < 0.05; ** p < 0.01. |