
- Title
-
Knockout of miR-184 in zebrafish leads to ocular abnormalities by elevating p21 levels
- Authors
- Zhang, J., Li, P., Sun, L., Jiang, N., Guo, W., Wang, J., Gao, F., Li, J., Li, H., Zhang, J., Mu, H., Hu, Y., Cui, X.
- Source
- Full text @ FASEB J.
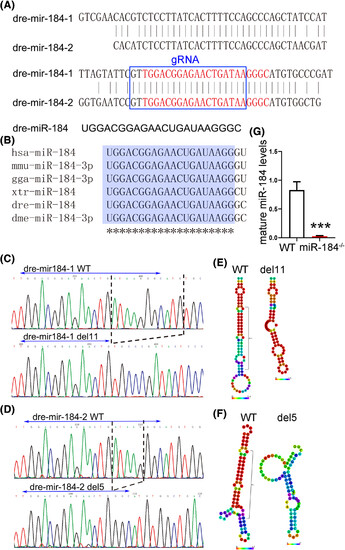
Knockout of miR-184 in zebrafish. (A) The gRNA was designed to target the identical seed sequence (marked in red) in both dre-mir-184-1 and dre-mir-184-2. (B) The mature miR-184 sequence is extremely conserved among human, mouse, chicken, frog, fish, and fruit fly. (C and D) The deletions of dre-mir-184-1 and dre-mir-184-2 were identified by direct sequencing in miR-184 knockout zebrafish line. (E and F) The deletions of dre-mir-184-1 and dre-mir-184-2 altered the stem-loop secondary structure of zebrafish miR-184 precursors. (G) The levels of mature miR-184 were detected in wild-type (WT) and miR-184 knockout (miR-184−/−) zebrafish. Student t-test was used for statistical analysis, n = 3, ***p < .001.
|
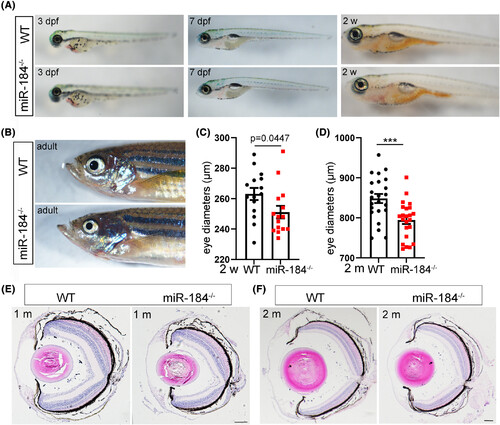
Knockout of miR-184 led to microphthalmia in zebrafish. (A) The gross development and growth were normal in embryonic WT and miR-184−/− zebrafish. (B) Microphthalmia is observed in adult WT and miR-184−/− zebrafish. (C and D) The eye diameters were significantly reduction in 2-week- (n = 15) and 2-month-old (n = 24) miR-184−/− zebrafish. Student t-test was used for statistical analysis, ***p < .001. (E and F) Except for microphthalmia, no other eye abnormities were observed in 1-month- and 2-month-old WT and miR-184−/− zebrafish histological sections. Bar, 100 μm.
|
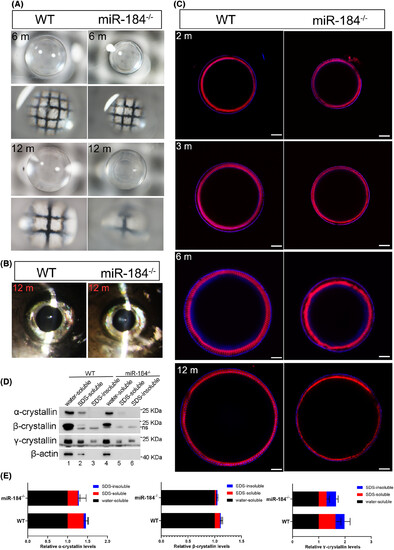
Mir-184−/− zebrafish displayed a cataract phenotype. (A) The cataract phenotype was detected using a grid transmission assay in 6-month-old and 12-month-old miR-184−/− zebrafish. (B) The cataract phenotype of miR-184−/− zebrafish was observed with a split lamp microscope. (C) WT and miR-184−/− lenses were stained with phalloidin to label the F-actin of lens cytoskeleton at 2 mpf, 3 mpf, 6 mpf, and 12 mpf. The nuclei were stained with DAPI. Bar, 100 μm. (D) The water solubility, SDS-solubility, and SDS-insolubility of lens crystallin in 6-month-old WT and miR-184−/− lenses were analyzed by immunoblotting. β-actin was as the endogenous control. ns, nonspecific bands. (E) The quantitation of α-, β-, and γ-crystallin levels in (D). The data showed means ± SD.
|
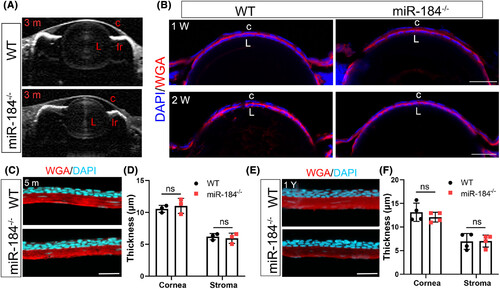
No corneal abnormity was observed in miR-184−/− zebrafish. (A) The anterior corneal morphology of 3-month-old miR-184−/− zebrafish was observed with a AS-OCT. L, lens; C, cornea; Ir, iris. (B) The cornea development was detected in embryonic WT and miR-184−/− zebrafish. The corneal epithelia were labeled with DAPI staining, while the stroma was stained with Alexa Fluor™ 594-conjugated WGA. L, lens; C, cornea. Bar, 25 μm. (C and D) The corneal structure (C) and thickness (D) were detected in 5-month-old WT and miR-184−/− zebrafish. Student t-test was used for statistical analysis, n = 3. ns, no significant. Bar, 50 μm. (E and F) The corneal structure (E) and thickness (F) were detected in 1-year-old WT and miR-184−/− zebrafish. Student t-test was used for statistical analysis, n = 4. ns, no significant. Bar, 50 μm.
|
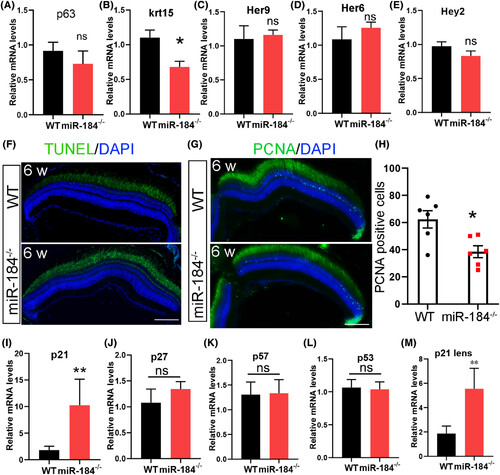
Depletion of miR-184 resulted in aberrant cell proliferation and elevated p21 levels. (A–E) The mRNA levels of p63, krt15, Her9, Her6, and Hey2 were analyzed in 3-month-old WT and miR-184−/− optic cups (eye tissue without lens). Student t-test was used for statistical analysis, n = 3. p < .05. (F) The TUNEL signals were detected in 1.5-month-old WT and miR-184−/− retinas. The nuclei were stained with DAPI. Bar, 100 μm. (G) The PCNA signals were detected in 1.5-month-old WT and miR-184−/− retinas. The nuclei were stained with DAPI. Bar, 100 μm. (H) The number of PCNA-positive cells in (B) were counted. Student t-test was used for statistical analysis, n = 6. *p < .05. (I–L) The mRNA levels of p21, p27, p57, and p53 were analyzed in 3-month-old WT and miR-184−/− optic cups (eye tissue without lens). Student t-test was used for statistical analysis, n = 3. **p < .01. (M) The p21 mRNA levels were analyzed in 3-month-old WT and miR-184−/− lenses. Student t-test was used for statistical analysis, n = 3. **p < .01.
|
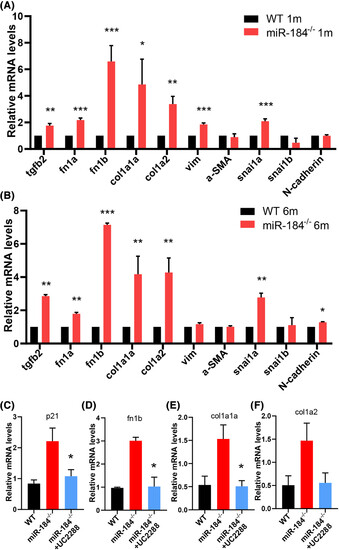
Inhibition of p21 reduced the expression of lens fibrosis markers in miR-184−/− lenses. (A and B) The mRNA levels of lens fibrosis markers were detected in 1-month-old and 6-month-old WT and miR-184−/− lenses. Student t-test was used for statistical analysis, n = 3. *p < .05; **p < .01; ***p < .001. (C–F) The 2-month-old miR-184−/− zebrafish were incubated with 5 μg/mL p21 inhibitor UC2288 for 12 h, and then the mRNA levels of p21 and lens fibrosis markers were detected. Student t-test was used for statistical analysis, n = 5. *p < .05.
|
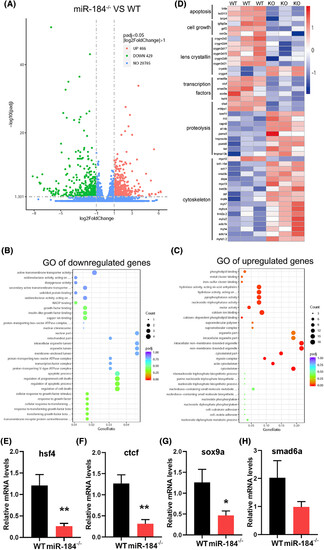
Differentially expressed genes between WT and miR-184−/− eyes. (A) The volcano plot shows the differentially expressed genes (466 upregulated and 429 downregulated) between 1-month-old WT and miR-184−/− eyes identified by RNA-seq. The red and green points indicate the upregulated and downregulated genes, respectively. (B and C) Gene Ontology (GO) analysis was performed to classify the downregulated (B) and upregulated (C) genes. (D) The functional categories enriched among the differentially expressed genes between WT and miR-184−/− eyes. High expression changes are shown in red, low expression changes are shown in blue and little expression changes are shown in white. (E–H) The mRNA levels of hsf4, sox9a, ctcf, and smad6a were detected in 1-month-old WT and miR-184−/− eyes. Student t-test was used for statistical analysis, n = 3. *p < .05; **p < .01.
|
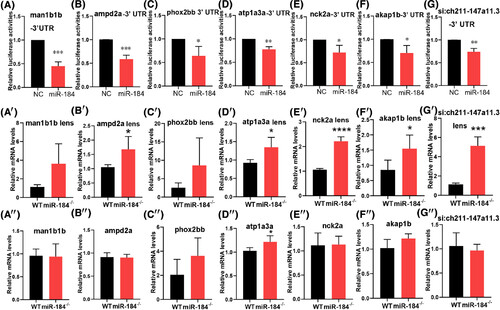
Identification of direct target genes of miR-184 in zebrafish. (A–G) The predicted targets of zebrafish miR-184 were confirmed with luciferase reporter assay. Student t-test was used for statistical analysis, n = 3. *p < .05; **p < .01; ***p < .001. (A′–G′) The mRNA levels of miR-184 predicted targets were detected in 3-month-old WT and miR-184−/− lenses. Student t-test was used for statistical analysis, n = 3. *p < .05; ***p < .001; ****p < .0001. (A″–G″) The mRNA levels of miR-184 predicted targets were detected in optic cup tissues of 3-month-old WT and miR-184−/− zebrafish. Student t-test was used for statistical analysis, n = 3. *p < .05.
|