
- Title
-
Identification of fish spermatogenic cells through high-throughput immunofluorescence against testis with an antibody set
- Authors
- Ye, D., Liu, T., Li, Y., Wang, Y., Hu, W., Zhu, Z., Sun, Y.
- Source
- Full text @ Front Endocrinol (Lausanne)

A simplified workflow and validation of antibodies by Western blot. (A) A simplified flow chart of antibody preparation. (B) Validation of the antibodies by Western blot. (C) Route diagram of the experimental procedures; the preparation of adhesive coverslips and immunofluorescence are performed in 24-well plates; (D) The schematic showing freezing sample in OCT; (E) The schematic showing coating with PLL; (F) The schematic showing mounting sample. |

Progressively decreased expression of Ddx4 along spermatogenesis. (A) The graph showing the nuclear diameter of different types of spermatogenic cells. (B) The graph showing the DAPI intensity of different types of spermatogenic cells relative to that of the SPG-A(2,4,8-cell). (C, C1) Representative images of a zebrafish testis section showing the expression of Ddx4 (magenta) co-stained with DAPI (cyan). (D) The graph showing the Ddx4 intensity of different types of spermatogenic cells relative to that of the SPG-A(2,4,8-cell). (E-L, E1-L1) The Representative images showing the SPG-A(1-cell) (E, E1), the SPG-A(2,4,8-cell) (F, F1), the SPG-B(16,32-cell) (G, G1), the SPG-B(64,128,256-cell) (H, H1), the SPC-I (I, I1), the SPC-II (J, J1), the SPD (K, K1) and the SPZ (L, L1). (M-P, M1, P1) The representative images showing the expression of Ddx4 in Gobiocypris rarus (M, M1), Cyprinus carpio (N, N1), Megalobrama amblycephala (O, O1), Monopterus albus (P, P1) and Ctenopharyngodon idella (Q, Q1). SPG-As are indicated by the arrows, and other types of spermatogenic cells are circled by dashed lines. All data were collected from three independent testicular samples. All values are the mean ± STD. Unpaired and two-tailed Student’s t-test were used to compare means. *P<0.05; **P<0.01; ***P<0.001, n.s. not significant. |
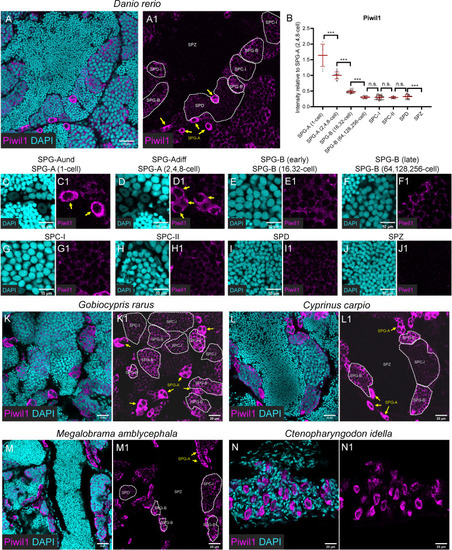
Piwil1 was highly expressed in the SPG-A, and expressed in the SPD but not in the SPZ. (A, A1) Representative images of a zebrafish testis section showing the expression of Piwil1 (magenta) co-stained with DAPI (cyan). (B) The graph showing the Piwil1 intensity of different types of spermatogenic cells relative to that of the SPG-A(2,4,8-cell). (C-J, C1-J1) The Representative images showing the SPG-A(1-cell) (E, E1), the SPG-A (2,4,8-cell) (F-F1), the SPG-B(16,32-cell) (G, G1), the SPG-B(64,128,256-cell) (H, H1), the SPC-I (I, I1), the SPC-II (J, J1), the SPD (K, K1) and the SPZ (L, L1). (K-M, K1-M1) The representative images showing the expression of Piwil1 in Gobiocypris rarus (K, K1), Cyprinus carpio (L, L1), Megalobrama amblycephala (M, M1) and Ctenopharyngodon idella (N, N1). SPG-As are indicated by the arrows, and other types of spermatogenic cells are circled by dashed lines. All data were collected from three independent testicular samples. All values are the mean ± STD. Unpaired and two-tailed Student’s t-test were used to compare means. ***P < 0.001, n.s. not significant. |
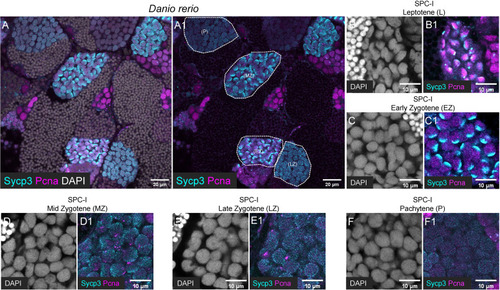
Characterization of different subtypes of SPC-I by co-staining of Sycp3 and Pcna. (A, A1) The representative images of a zebrafish testis section showing the co-staining of Sycp3 (cyan), Pcna (magenta) and DAPI (grey). (B-F, B1-F1) The representative image showing the SPC-I (Leptotene/L) (B, B1), the SPC-I (Early Zygotene/EZ) (C, C1), the SPC-I (Mid Zytotene/MZ) (D, D1), the SPC-I (Late Zygotene/LZ) (E, E1) and the SPC-I (Pchytene/P) (F, F1). Different subtypes of SPC-I are circled by dashed lines. |

The applicability of the Sycp3 and Pcna antibody for immunofluorescence in the other five selected fishes. (A, A1) The representative images showing the expression of Sycp3 in Monopterus albus. (B-E, B1-E1) The representative images showing the expression of Pcna in Gobiocypris rarus (B, B1), Cyprinus carpio (C, C1), Megalobrama amblycephala (D, D1), Monopterus albus (E, E1) and Ctenopharyngodon idella (F, F1). SPG-As are indicated by the arrows, and other types of spermatogenic cells are circled by dashed lines. |
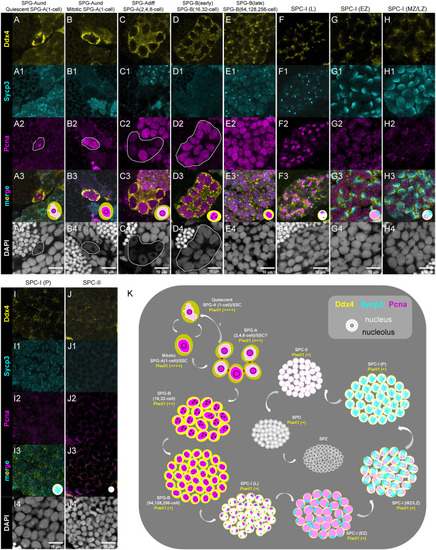
Characterization of different types/subtypes of spermatogenic cells by triple-staining of Ddx4, Sycp3 and Pcna. (A-J, A1-J1, A2-J2, A3-J3, A4-J4) The representative images of showing the co-staining of Ddx4 (yellow), Sycp3 (cyan), Pcna (magenta) and DAPI (grey) in the quiescent SPG-A(1-cell) (A-A4), the miotic SPG-A(1-cell) (B-B4), the SPG-A(2,4,8-cell) (C-C4), the SPG-B(16,32-cell) (D-D4), the SPG-B(64,128,256-cell), the SPC-I (L) (F-F4), the SPC-I (EZ) (G-G4), SPC-I (MZ/LZ) (H-H4), SPC-I (P) (I-I4), and the SPC-II (J-J4). Some of the indicated cells are circled by dashed lines to help identifying. (K) A schematic diagram showing the expression of the four proteins in the different types and subtypes of spermatogenic cells. SPG-A(1-cell) can be identified by the highest expression of Ddx4 and Piwil1. SPG-Bs including SPG-B(16,32-cell) and SPG-B(64,128,256-cell) are identified by the second highest expression of Ddx4 and the high expression of Pcna, while the later shows nuclear signal of Sycp3. Different subtypes of SPC-I can be identified by the expression patterns of Sycp3 and Pcna. SPD can be distinguished from SPZ by the expression of Piwil1 or Ddx4. |