
|
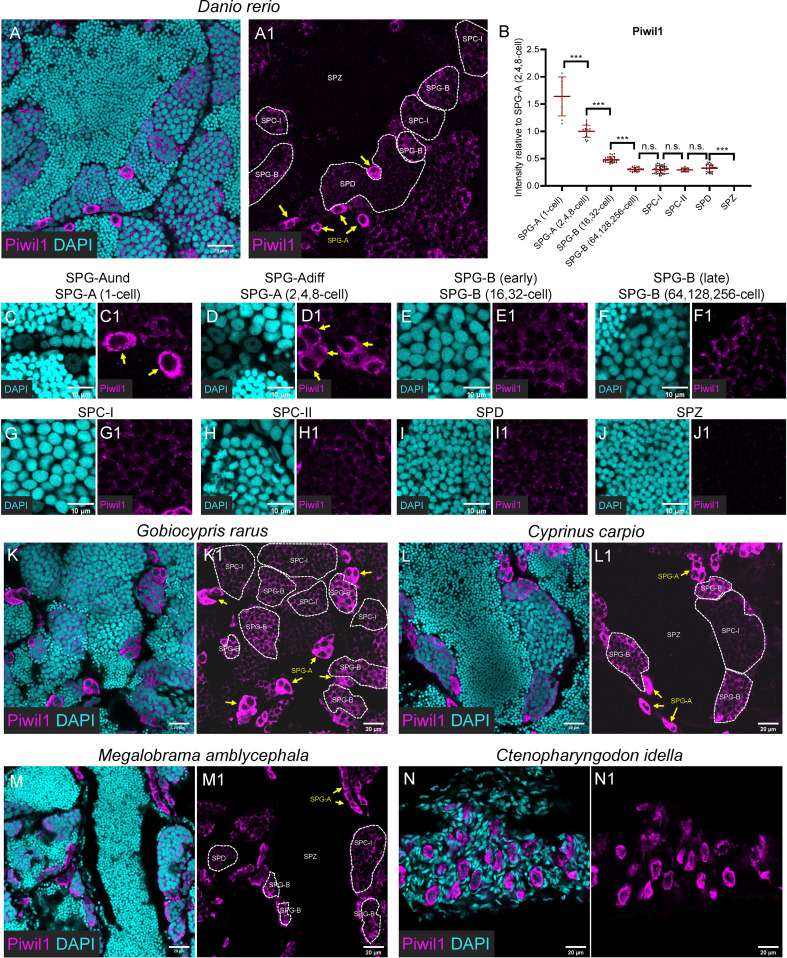
Figure 3
Piwil1 was highly expressed in the SPG-A, and expressed in the SPD but not in the SPZ. (A, A1) Representative images of a zebrafish testis section showing the expression of Piwil1 (magenta) co-stained with DAPI (cyan). (B) The graph showing the Piwil1 intensity of different types of spermatogenic cells relative to that of the SPG-A(2,4,8-cell). (C-J, C1-J1) The Representative images showing the SPG-A(1-cell) (E, E1), the SPG-A (2,4,8-cell) (F-F1), the SPG-B(16,32-cell) (G, G1), the SPG-B(64,128,256-cell) (H, H1), the SPC-I (I, I1), the SPC-II (J, J1), the SPD (K, K1) and the SPZ (L, L1). (K-M, K1-M1) The representative images showing the expression of Piwil1 in Gobiocypris rarus (K, K1), Cyprinus carpio (L, L1), Megalobrama amblycephala (M, M1) and Ctenopharyngodon idella (N, N1). SPG-As are indicated by the arrows, and other types of spermatogenic cells are circled by dashed lines. All data were collected from three independent testicular samples. All values are the mean ± STD. Unpaired and two-tailed Student’s t-test were used to compare means. ***P < 0.001, n.s. not significant.