
- Title
-
A temporal single cell transcriptome atlas of zebrafish anterior segment development
- Authors
- Vöcking, O., Famulski, J.K.
- Source
- Full text @ Sci. Rep.

Strategy for generating ASM single cell transcriptomes over the course of early AS development. (A) Volume projections of ventral and dorsal views from 3D confocal stacks of whole mount Tg[foxc1b:GFP] embryos at 24, 48, 72, 96, 120 and 144 hpf. GFP+ cells (green) can be seen populating the AS regions by 48 hpf and assembling the typical doughnut like AS localization pattern from 72-144 hpf. DAPI (blue) was used to stain for nuclei. (B) Cryosections of Tg[foxc1b:GFP] embryos at 48, 72, 96, 120 and 144 hpf captured using confocal microscopy. GFP signal (green) is found in the AS regions in each of the time points. Transmitted light was used to capture tissue architecture. (C) Schematic for capture and subsequent assembly of single cell ASM transcriptomes. Dissected whole eyes were dissociated and GFP+ cells isolated using FACS. Subsequently single cells are captured using the 10X Genomics Chromium and the resulting single cell cDNA sequenced and analyzed. |
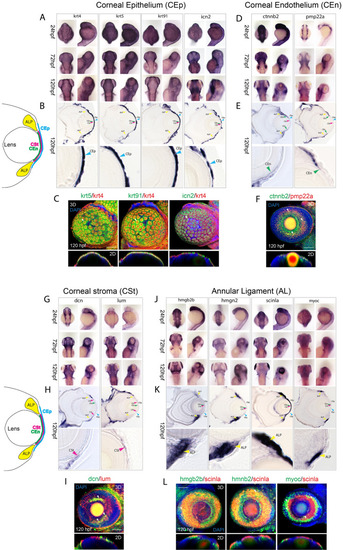
Assembly of markers for developing zebrafish corneal epithelium, endothelium, stroma and annular ligament. (A) WISH analysis of corneal epithelium markers krt4, ktr5, krt91 and icn2 expression at 24, 72 and 120 hpf displayed in dorsal and lateral views. (B) 10 µm cryosections of 120 hpf embryo eyes after WISH. C) Two color FWISH depicting co-expression of krt4(red)/krt5(green), krt91(green)/krt4(red) and icn2(green)/krt4(red) at 120 hpf. DAPI (blue) was used to stain the nuclei. Volume projections in lateral view and single section dorsal views from 3D confocal stacks are displayed. White arrows indicate example regions of co-expression. Scale bar = 100 µm. Individual fluorescence channels are provided in Fig. S1A. (D) WISH analysis of corneal endothelium markers ctnnb2 and pmp22a expression at 24, 72 and 120 hpf displayed in dorsal and lateral views. (E)10 µm cryosections of 120 hpf embryo eyes after WISH. (F) Two color FWISH depicting co-expression of pmp22a(red)/ctnnb2(green) at 120 hpf. DAPI (blue) was used to stain the nuclei. Volume projections in lateral view and single section dorsal views from 3D confocal stacks are displayed. White arrows indicate example regions of co-expression. Scale bar = 100 µm. Individual fluorescence channels are provided in Fig. S1B. (G) WISH analysis of corneal stroma markers dcn and lum expression at 24, 72 and 120 hpf displayed in dorsal and lateral views. (H)10 µm cryosections of 120 hpf embryo eyes after WISH. (I) Two color FWISH depicting co-expression of lum(red)/dcn(green) at 120 hpf. DAPI (blue) was used to stain the nuclei. Volume projections in lateral view and single section dorsal views from 3D confocal stacks are displayed. White arrows indicate example regions of co-expression. Scale bar = 100 µm. Individual fluorescence channels are provided in Fig. S1C. (J) WISH analysis of annular ligament markers hmgb2b, hmgn2, scinla and myoc expression at 24, 72 and 120 hpf displayed in dorsal and lateral views. K)10 µm cryosections of 120 hpf embryo eyes after WISH. (L) Two color FWISH depicting co-expression of hmgb2b(green)/scinla(red), hmnb2(green)/scinla(red) and myoc(green)/scinla(red) at 120 hpf. DAPI (blue) was used to stain the nuclei. Volume projections in lateral view and single section dorsal views from 3D confocal stacks are displayed. White arrows indicate example regions of co-expression. ALP Annular ligament progenitor (yellow arrow), CEp Corneal epithelium (blue arrow), CEn Corneal endothelium (green arrow), CSt Corneal stroma (green arrow). Scale bar = 100 µm. Individual fluorescence channels are provided in Fig. S1D. |

Clustering of purified ASM throughout early AS development. Cluster numbers are indicated in brackets. (A) Cluster distribution at 48 hpf. The five clusters observed were identified as: CEp1(2), CEp2(5), AL1(1), AL2(3) and sensory neurons(4). (B) Cluster distribution at 72 hpf. The four clusters observed were identified as: AL, CEp, retina and pigment cells. (C) Cluster distribution at 96 hpf. The nine clusters observed were identified as: CEp1(1), AL2/CEn(2), AL1(3), CEp2(4), AL1/CEn + CSt(5), retina(6), AL1/CEn + CSt(7), pigment cell(8), unknown(9). (D) Cluster distribution at 120 hpf. The fifteen clusters observed were identified as: AL1.1(1), AL2/CSt(2), CEp1(3), AL1/CEn + CSt(4), AL1.2(5), unknown(6), retina(7), AL1.3(8), retina(9), RGC(10), unknown(11). unknown(12), CEp2(13), unknown(14), unknown(15). (E) Cluster distribution at 144 hpf. The twelve clusters observed were identified as: AL1.1(1), retina(2), AL2/CEn(3), retina(4), retina(5), CEp1(6), CEp2(7), RPE(8), AL1.3(9), AL1/CEn + CSt(10), CEn(11), unknown(12). |

Top 10 genes for AS related cell types at each timepoint examined. (A) Top10 genes from AL1, AL2, CEp1 and CEp2 at 48 hpf. (B) Top10 genes from AL and CEp clusters at 72 hpf. (C) Top10 genes from AL1, AL1/CEn + Cst, AL2/CEn, CEp1 and CEp2 clusters at 96 hpf. (D) Top10 genes from AL1.1, AL1.2, AL1.3, AL1/CEn + CSt, AL2/CEn, CEp1 and CEp2 at 120 hpf. (E) Top10 genes from AL1.2, AL1.3, AL1/CEn + CSt, AL2/CEn, CEn, CEp1 and CEp2 at 144 hpf. Scale of degree of expression and percentage is indicated. |

Cluster trajectories during early development of corneal epithelium, endothelium, stroma, and annular ligament. Developmental trajectories of individual clusters from each timepoint, 48–144 hpf, displaying temporal relationships. Numbers in brackets correspond to timepoint specific clusters (Fig. 3). Arrows indicate lineage relationships of the AL1 (blue), AL2/CEn (magenta), AL1/CEn + CSt (blue), CEn (light blue), CEp1 (purple) and CEp2 (pink) cell types. CEp lineages show early and dedicated commitment while AL lineages display multipotency for AL, CEn or CSt cell types. |

Pseudotime analysis of purified ASM cells during early AS development. (A) The trajectory analysis showing three major trajectories including CEp, AL + CEn/CSt, AL1. (B) Marker genes for the different cornea tissues and annular ligament projected onto the trajectory graph. Markers for CEp1: krt4 and icn2, for CEp2: krt5, krt91, for CSt: dcn and lum, for CEn pmp22a and ctnnb2, for AL1: hmgb2b and hmgn2 and for Al2: scinla and lxn. |

Spatiotemporal expression patterns of conserved corneal epithelium and endothelium associated genes. (A) WISH analysis of corneal epithelium associated genes zgc:92,380, sparc, pfn1, epcam and col1a1b expression at 24, 72 and 120 hpf displayed in dorsal and lateral views. (B) 10 µm cryosections of 120 hpf embryo eyes after WISH. (C) Two color FWISH depicting co-expression of krt4(red)/zgc:92,380(green), sparc(green)/krt4(red), pfn1(green)/krt4(red), epcam(green)/krt4(red) and col1a1b(green)/krt4(red) at 120 hpf. DAPI (blue) was used to stain the nuclei. Volume projections in lateral view and single section dorsal views from 3D confocal stacks are displayed. White arrows indicate example regions of co-expression. Scale bar = 100 µm. Individual fluorescence channels are provided in Fig. S10. (D) Average mean expression measurements from CEp1 and CEp2 clusters for marker genes krt4, krt5, krt91 and icn2 as well as col1a1b, epcam, pfn1, sparc and zgc92380 at each timepoint examined, 48–144 hpf. (E) WISH analysis of corneal endothelium associated genesmatn4 and cthrc1a expression at 24, 72 and 120 hpf displayed in dorsal and lateral views. (F) 10 µm cryosections of 120 hpf embryo eyes after WISH. (G) Average mean expression measurements from CEn clusters for pmp22a, ctnnb2, matn4 and cthrc1a at each timepoint examined, 48–144 hpf. ALP Annular ligament progenitor (yellow arrow), CEp Corneal epithelium (blue arrow), CEn Corneal endothelium (green arrow), CSt Corneal stroma (green arrow). |

Spatiotemporal expression patterns of conserved annular ligament associated genes. (A) WISH expression analysis of annular ligament 1 (AL1) associated genes nusap1, frzb, cxcr4b, rrn2 and cdh5 at 24, 72 and 120 hpf displayed in dorsal and lateral views. (B) 10 µm cryosections of 120 hpf embryo eyes after WISH. (C) Two color FWISH depicting co-expression of nusap1(green)/scinla(red), frzb(green)/scinla(red), cxcr4b(green)/scinla, rrn2(green)/scinla(red) and cdh5(green)/scinla(red) at 120 hpf. DAPI (blue) was used to stain the nuclei. Volume projections in lateral view and single section dorsal views from 3D confocal stacks are displayed. White arrows indicate example regions of co-expression. Scale bar = 100 µm. Individual fluorescence channels are provided in Fig. S11A. (D) Average mean expression measurements from AL1 clusters for genes nusap1, frzb, cxcr4b rrn2, and cdh5 at each timepoint examined, 48-144 hpf. (E) WISH expression analysis of annular ligament 2 (AL2) associated genes mcm7, vim, lxn, fmoda and fabp11a at 24, 72 and 120 hpf displayed in dorsal and lateral views. (F) 10 µm cryosections of 120 hpf embryo eyes after WISH. (G) Two color FWISH depicting co-expression of mcm7(green)/scinla(red), vim(green)/scinla(red), lxn(green)/scinla, fmoda(green)/scinla(red) and fabp11a(green)/scinla(red) at 120 hpf. DAPI (blue) was used to stain the nuclei. Volume projections in lateral view and single section dorsal views from 3D confocal stacks are displayed. White arrows indicate example regions of co-expression. Scale bar = 100 µm. Individual fluorescence channels are provided in Fig. S11B. (H) Average mean expression measurements from AL2 clusters for genes mcm7, vim, lxn, fmoda and fabp11a over developmental time. ALP Annular ligament progenitor (yellow arrow), CEp corneal epithelium (blue arrow), CEn Corneal endothelium (green arrow), CSt Corneal stroma (green arrow). |
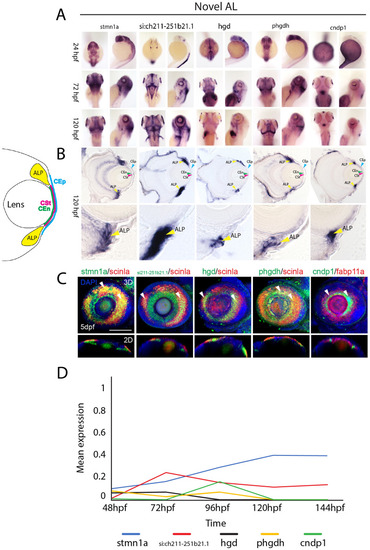
Expression patterns of novel annular ligament associated genes. (A) WISH expression analysis of annular ligament associated genes stmn1a, si:211-251b21.1, hgd, phgdh and cndp1 at 24, 72 and 120 hpf displayed in dorsal and lateral views. (B) 10 µm cryosections of 120 hpf embryo eyes after WISH. (C) Two color FWISH depicting co-expression of stmn1a(green)/scinla(red), si:ch211-252b21.1(green)/scinla(red), hgd(green)/scinla, phgdh(green)/scinla(red) and cndp1(green)/scinla(red) at 120 hpf. DAPI (blue) was used to stain the nuclei. Volume projections in lateral view and single section dorsal views from 3D confocal stacks are displayed. White arrows indicate example regions of co-expression. Scale bar = 100 µm. Individual fluorescence channels are provided in Fig. S11C. (D) Average mean expression measurements over developmental time. ALP Annular ligament progenitor (yellow arrow), CEp Corneal epithelium (blue arrow), CEn Corneal endothelium (green arrow), CSt Corneal stroma (green arrow). |