
- Title
-
DRAM1 Promotes Lysosomal Delivery of Mycobacterium marinum in Macrophages
- Authors
- Banducci-Karp, A., Xie, J., Engels, S.A.G., Sarantaris, C., van Hage, P., Varela, M., Meijer, A.H., van der Vaart, M.
- Source
- Full text @ Cells

DRAM1 colocalises with acidified mycobacteria-containing vesicles. (A) DRAM1 (magenta) localisation at the plasma membrane (arrowheads) of non-infected cells. Scale bars: 5 μm. (B) DRAM1 (magenta) colocalisation with acidic vesicles stained by LysoTracker (yellow). A region showing a LysoTracker-positive and a LysoTracker-negative DRAM1-stained vesicle is outlined, with a dotted box in the merged image that is enlarged in the inset. Scale bars: 5 μm. (C) Representative examples of DRAM1 (magenta) colocalisation patterns with Mm (cyan), referred to as membrane, punctate, and luminal patterns. An example of DRAM1-negative Mm (none) is also shown. Acidification of Mm-containing vesicles was assessed by LysoTracker staining (yellow). Scale bars: 2 μm. (D) Frequency of Mm colocalisation with DRAM1 or LysoTracker over time. (E) Frequency of Mm colocalisation with DRAM1 in punctate, membrane, or luminal patterns over time. (F) Frequency of LysoTracker colocalisation with DRAM1-negative Mm and DRAM1-positive membrane, punctate, and luminal Mm patterns over time. Data were accumulated from two independent experiments with the following total numbers of Mm observations per time point: 71 for t = 0, 73 for t = 30, 105 for t = 60, 98 for t = 90, 102 for t = 120 and 111 for t = 150 min. |

Acidified mycobacteria-containing vesicles are labelled by LC3. (A) Representative examples of LC3 (magenta) colocalisation patterns with Mm (cyan), referred to as punctate and luminal patterns. An example of LC3-negative Mm (none) is also shown. Acidification of Mm-containing vesicles was assessed by LysoTracker staining (yellow). Scale bars: 2 μm. (B) Representative examples of the double colocalisation of LC3 (magenta) and DRAM1 (grey) with Mm (cyan). Scale bars: 2 μm. (C) Frequency of Mm colocalisation with LC3 or LysoTracker over time. (D) Frequency of Mm colocalisation with LC3 in punctate or luminal patterns over time. (E) Frequency of LysoTracker colocalisation with LC3-negative Mm and LC3-positive punctate and luminal Mm patterns over time. Data were accumulated from two independent experiments with the following total numbers of Mm observations per time point: 99 for t = 0, 129 for t = 30, 96 for t = 60, 124 for t = 90, 133 for t = 120 and 127 for t = 150 min. |
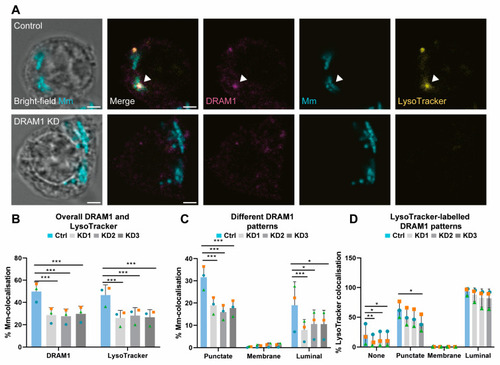
DRAM1 knockdown reduces the acidification of Mm-containing vesicles. (A) Representative c with Mm (cyan) in control (Ctrl) and DRAM1 knockdown cell lines (KD1-3), at 120 min post infection. The arrowheads indicate the colocalisation of DRAM1, Mm, and LysoTracker. Scale bars: 2 μm. (B) Percentage of colocalisation of Mm with DRAM1 or LysoTracker in DRAM1 knockdown and control cell lines. (C) Percentage of colocalisation of Mm with DRAM1 in punctate, membrane, and luminal patterns in DRAM1 knockdown and control cell lines. (D) Percentage of colocalisation of LysoTracker with DRAM1-negative Mm (none) and DRAM1-positive punctate, membrane and luminal Mm patterns, in DRAM1 knockdown and control cell lines. Bar graphs show the data from three independent experiments, where the mean of each replicate is indicated with a colored symbol. In total, 18 ROIs were analysed per control or DRAM1 knockdown (KD1-3) group, with the following total numbers of Mm observations per group: Ctrl = 591, KD1 = 632, KD = 525, and KD3 = 567. Statistical significance was assessed by beta-binomial logistic regression with Dunnett’s multiple test correction. Error bars represent the standard deviation of the three independent replications of the experiment. (* p < 0.05; ** p < 0.01; *** p < 0.001). |

DRAM1 knockdown reduces LC3 trafficking to Mm. (A) Representative examples of LC3 (magenta) and LysoTracker (yellow) colocalisation with Mm (cyan) in DRAM1 knockdown (KD1-3) and control (Ctrl) cell lines at 120 min post infection. The arrowheads indicate the colocalisation of LC3, Mm and LysoTracker. Scale bars: 2 μm. (B) Percentage of colocalisation of Mm with LC3 or LysoTracker in DRAM1 knockdown and control cell lines. (C) Percentage of colocalisation of Mm with LC3 in punctate and luminal patterns, in DRAM1 knockdown and control cell lines. (D) Percentage of colocalisation of LysoTracker with LC3-negative Mm and LC3-positive punctate and luminal Mm patterns, in DRAM1 knockdown and control cell lines. Bar graphs show the data from three independent experiments, where the mean of each replicate is indicated with a colored symbol. In total, 18 ROIs were analysed per control or DRAM1 knockdown (KD1-3) group, with the following total numbers of Mm observations per group: Ctrl = 527, KD1 = 551, KD2 = 516, KD3 = 537. Statistical significance was assessed by beta-binomial logistic regression with Dunnett’s multiple test correction. Error bars represent the standard deviation of the three independent replications of the experiment. (* p < 0.05; ** p < 0.01; *** p < 0.001). |

DRAM1 knockdown reduces LAMP1 staining of Mm-containing vesicles. (A) Representative examples of LAMP1 (magenta) colocalisation patterns with Mm (cyan), referred to as membrane, punctate, and luminal patterns, at 120 min post infection. Acidification of Mm-containing vesicles was assessed by LysoTracker staining (yellow). Scale bars: 2 μm. (B) Representative examples of LAMP1 (magenta) colocalisation with Mm (cyan), and of the acidification of Mm-containing vesicles, assessed by LysoTracker staining (yellow) in DRAM1 knockdown (KD1-3), as well as control cell lines, at 120 min post infection. The arrowheads indicate colocalisation of LAMP1, Mm and LysoTracker. Scale bars: 2 μm. (C) Percentage of colocalisation of Mm with LAMP1 or LysoTracker in DRAM1 knockdown and control cell lines. (D) Percentage of colocalisation of Mm with LAMP1 in punctate, membrane, and luminal patterns, in DRAM1 knockdown and control cell lines. (E) Percentage of colocalisation of LysoTracker with LAMP1-negative Mm and LAMP1-positive Mm punctate, membrane, and luminal Mm patterns, in DRAM1 knockdown and control cell lines. Bar graphs show the data from three independent experiments, where the mean of each replicate is indicated with a colored symbol. In total, 18 ROIs were analysed per control or DRAM1 knockdown (KD1-3) group, with the following total numbers of Mm observations per group: Ctrl = 479, KD1 = 473, KD2 = 469, and KD3 = 502. Significance was assessed by beta-binomial logistic regression with Dunnett’s multiple test correction. Error bars represent the standard deviation of the three independent replications of the experiment (* p < 0.05; ** p < 0.01; *** p < 0.001). |
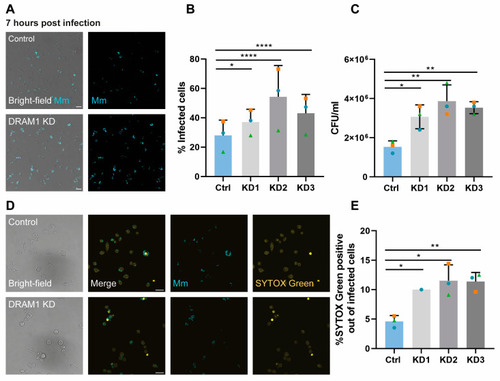
DRAM1 knockdown increases the susceptibility of macrophages to Mm infection. (A) Representative examples of infected cells in DRAM1 knockdown and control cell lines at 7 h post infection. Scale bars: 20 μm (B) Percentage of infected cells in DRAM1 knockdown (KD1-3) and control cells at 7 h post infection. (C) CFU/mL in DRAM1 knockdown cells normalised to the control cell lines at 7 h post infection. (D) Representative examples of SYTOX Green staining of Mm- infected DRAM1 knockdown and control cells at 7 h post infection. Scale bars: 20 μm. (E) Percentage of SYTOX green-positive infected cells in DRAM1 knockdown and control cell lines at 7 h post infection. Bar graphs (B,C,E) show the data from three independent experiments, where the mean of each replicate is indicated with a colored symbol. All replicates in (B,C) were performed with 3 knockdown lines (KD1-3), while the data in (E) are based on 3 replicates for KD2 and KD3 and 1 replicate for KD1. Statistical significance was assessed by one-way ANOVA and pairwise comparison with Dunnett’s correction. (* p < 0.05; ** p < 0.01; **** p < 0.0001). |