
- Title
-
Cell-type-specific responses to the microbiota across all tissues of the larval zebrafish
- Authors
- Massaquoi, M.S., Kong, G.L., Chilin-Fuentes, D., Ngo, J.S., Horve, P.F., Melancon, E., Hamilton, M.K., Eisen, J.S., Guillemin, K.
- Source
- Full text @ Cell Rep.

Single-cell transcriptional analysis of whole gnotobiotic larval zebrafish (A) Whole conventionalized (CVZ) and germ-free (GF) 6 dpf zebrafish larvae were dissociated into individual cells prior to single-cell RNA sequencing. (B) Uniform manifold approximation and projection (uMAP) plots display 78 cell type clusters shared between experimental groups. (C) Cell types were identified by their transcriptomic profile; examples (with marker genes) include enterocytes ( (D) Host cell types differentially respond to the presence of the microbiota throughout the body as illustrated by the total number of genes significantly enriched within each experimental group (p < 0.05). The height of the bars represents the total sum of differentially expressed genes in CVZ versus GF cells for each cluster. The colored portion of each bar represents the number of genes significantly expressed within CVZ cells and the remaining black portion of the bars represents the number of genes significantly expressed in GF cells (minus the colored portion). |

Integration of whole gnotobiotic larval zebrafish cells with dissected larval digestive system cells (A) uMAP plots display integration of single cells dissociated from whole larvae of the Gnotobiotic Atlas and dissected larval guts. (B) Clusters populated by cells from each experimental group confirm and illustrate digestive cell types from dissociation of whole larvae including enterocytes ( (C) uMAP plots show that cells from original epithelial cluster 45 include a minority of cells likely to be of the digestive system. The dot plot, and all following dot plots included in the manuscript, displays both the percentage of cells within a cluster or subcluster expressing a transcript (dot size) and expression level of the transcript (dot color). Expression of genes within this dot plot for a subcluster is relative to all other subclusters. Bolded subcluster numbers designated with an astersk within the dot plot indicate that the subclusters include cells originating from cluster 45 within their subcluster population. Dissected Intestinal Epithelia data were derived from GF larvae to mitigate contamination during the length of time needed to dissect a sufficient amount of sample. Arrows point to Cluster 61 in Mapping Intestinal Epithelia. |

Intestinal enterocytes and secretory cells exhibit cell-type-specific transcriptional responses to the microbiota (A) Cluster 11 is composed of enterocytes from the proximal intestine marked by high expression of (B) Mucin-secreting cells are localized to cluster 48 indicated by expression of (C) uMAP plots display integration of all (D) Subcluster 1 demonstrates consistent pairing of cells from each experimental group from the integration. (E) Dot plot illustrates enriched expression of several genes within CVZ cells of subcluster 1. GO plots in this figure and all following figures use bars to show the total number of genes included in a GO category. The number in parentheses displayed after a GO category title on the y axis signifies the number of GO terms binned into the category. GO terms are considered significant at p < 0.05 after a false discovery rate (FDR) p-corrected adjustment. |

Immune cells exhibit characteristic transcriptional responses to the microbiota (A and B) Clusters 35, 36, 72 and 76 (A) include several immune cell types that differentially express (B) neutrophil biomarker (C) GO analysis plot and dot plot represent genes significantly enriched within CVZ versus GF macrophages and neutrophils, showing similar trends in gene expression compared with conventional 5 dpf larvae of the Zebrafish Atlas. (D) GO analysis plot and dot plot represent genes significantly enriched within CV 5 dpf Zebrafish Atlas macrophages and neutrophils, showing similar trends in gene expression compared with 6 dpf CVZ cells. Genes designated with an asterisk were statistically enriched within CVZ versus GF cells. |
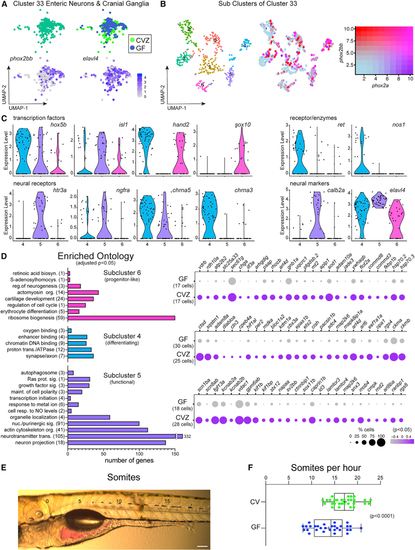
Enteric neurons are transcriptionally heterogeneous in response to the microbiota (A) Cluster 33 includes enteric neurons and cranial ganglia showing expression of (B) uMAP plots show transcriptional heterogeneity of cluster 33 with a range in co-expression of (C) Violin plots compare expression of enteric neuron transcription factors, neural receptors, and neural markers within subclusters 4, 5, and 6. (D) GO analysis plots represent genes enriched within subcluster 4, 5 or 6 relative to the other subclusters. The corresponding dot plots represents differential gene expression in CVZ versus GF cells for each subcluster. (E) Image displays a larval zebrafish post-gavage with phenol red dye. Numbers labeled on the image indicate the somite number. Scale bar of 100 μm corresponds to the micrograph. (F) Horizontal boxplots represent the rate of transit for the red dye post-gavage with respect to somite distance. In the box plots, the middle line representes the median, the right and left sides of the box represent the upper and lower quartiles, the whiskers represent the min and max values, and the plus symbol represents the mean. Each dot symbol represents data from a single 6 dpf zebrafish. The p value displayed is a result from Student’s t test. |

The microbiota induces global patterns of host gene expression (A) Dot plot illustrates global trends of gene expression across all CVZ and GF cells from whole larvae. (B) Boxplots show (i) the concentration of ATP from whole larvae, (ii) the ratio of ADP to ATP of dissected larval intestines, and (iii) the concentration of ATP in dissected CVZ and GF larval intestines alone or 20–40 min following gavage with 1 or 10 mM ATP. Each dot in the measurement of ADP/ATP ratio represents the average to two intestines. (C) Boxplots show the average relative optical density of beta and gamma crystallin protein expression in CVZ and GF larvae. Each symbol represents an individual flask of larvae processed together and matching symbols denote that flasks were from the same gnotobiotic derivation. Colored dots represent average expression between flasks in the same derivation with a line connecting the corresponding derivations between experimental groups. (D) uMAP plots represent CVZ cell clustering on the basis of expression of genes involved in ATP metabolism. Feature plots illustrate cell types maintaining their original cell type identity. (E) Hierarchal tree demonstrates the proximity of uMAP plot cells clustered by expression of ATP metabolism genes and the top GO terms on the basis of enriched genes within a given cluster. (F) uMAP plots represent corresponding GF cells from the original clusters used in (D) clustering on the basis of expression of crystallin genes. Feature plots show that clusters lose their original cell type identity. (G) Hierarchal tree demonstrates proximity of clusters from the uMAP plot of cells clustered by expression of |

The microbiota promotes tissue development and function within the exocrine pancreas (A) Cluster 32 is composed of acinar cells from the exocrine pancreas showing high expression of digestive enzymes (B) Violin plots illustrate the difference in distribution of pancreatic digestive enzyme gene expression between CVZ and GF cells from cluster 32. (C) Images display amylase protein expression within the exocrine pancreas of CVZ and GF larvae. Images are z projections taken by tile-scan with a confocal microscope. For the green channel, intensity levels were increased to illuminate the whole pancreas evenly for publication but had no impact of data generated from the raw images. Scale bar of 100 μm corresponds to the micrographs. (D) The violin plot illustrates the average optical intensity of individual amylase granules and the two box plots show the total volume occupied by the pancreas, and the number of amylase puncta per pancreas between CVZ- and GF-derived 6 dpf larvae. All images were taken with the same optical settings and larvae from each experimental group were imaged on the same day in the same session. Each clear dot in the violin plot represents an amylase+ puncta. Each dot in the subsequent two boxplots for pancreas volume and amylase puncta/pancreas represent individual larvae. p values displayed on plots are from Student’s t tests. |