
- Title
-
Time-Dependent Monitoring of Dopamine in the Brain of Live Embryonic Zebrafish Using Electrochemically Pretreated Carbon Fiber Microelectrodes
- Authors
- Dumitrescu, E., Deshpande, A., Wallace, K.N., Andreescu, S.
- Source
- Full text @ ACS Meas Sci Au

Comparison of the voltammetric response recorded before and after the pretreatment of CFMEs by constant potential amperometry at +1.0 V in 0.1 M NaOH for 600 s in the presence of 1 μM dopamine (A), epinephrine (B), norepinephrine (C), and serotonin (D). The DPV parameters were as follows: 4 mV potential increment, 50 mV pulse amplitude, 50 ms pulse width, and 200 ms pulse period. Only the first scan recorded is shown. All the voltammograms are background subtracted. |
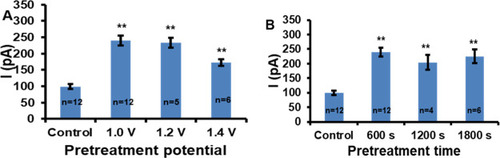
Optimization of alkaline pretreatment potential (A) and time (B). The signal showed is the average response to 1 μM dopamine measured by DPV (4 mV potential increment, 50 mV pulse amplitude, 50 ms pulse width, and 200 ms pulse period). The error bars represent the standard error of the mean for “n” independent microelectrodes. Statistical significance in comparison with the control experiment is calculated by the one-way ANOVA with the post-hoc Tukey HSD test and it is indicated by one (*) and two (**) asterisks at p < 0.05 and p < 0.01, respectively. |

Comparison of the voltammetric response recorded before and after the alkaline pretreatment of CFMEs for 1 μM dopamine, epinephrine, norepinephrine, serotonin, and ascorbate. The signal shown is the average response measured for each analyte by DPV (4 mV potential increment, 50 mV pulse amplitude, 50 ms pulse width, and 200 ms pulse period). Ascorbate was not detected within the used potential window. The error bars represent the standard error of the mean for “n” replicate experiments. Statistical significance between the two groups is calculated using the one-way ANOVA with the post-hoc Tukey HSD test and it is indicated by one (*) and two (**) asterisks at p < 0.05 and p < 0.01, respectively, or by “ns” for no statistical significance. |
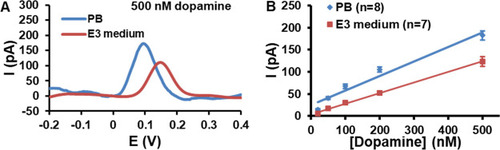
(A) Comparative response of pretreated CFMEs to 500 nM dopamine in PB and E3 medium. (B) Calibration curves for dopamine detection at pretreated CFMEs recorded in PB (R2 = 0.963) and E3 medium (R2 = 0.998). The signal showed is the average response measured for the varied concentrations of dopamine by DPV (4 mV potential increment, 50 mV pulse amplitude, 50 ms pulse width, and 200 ms pulse period). The error bars represent the standard error of the mean for “n” replicate experiments. |
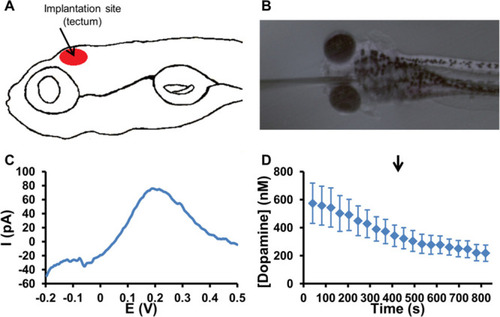
(A) Graphical representation of the implantation site in the tectum of 5 dpf zebrafish embryos. (B) Microscope image of a CFME implanted in the tectum of 5 dpf zebrafish embryos. (C) Typical DPV recorded at the implantation site in a 5 dpf zebrafish embryo exhibits an oxidation peak at 0.2 V associated with the oxidation of dopamine. (D) Average dopamine concentration–time trace measured in the tectum of 5 dpf zebrafish embryos. The arrow indicates the injection of deionized water in the near proximity of the embryos (control experiment) at 410 s. The error bars represent the standard error of the mean for n = 6 replicate experiments in individual embryos. |

(A) Typical DPVs recorded at the implantation site in a 5 dpf zebrafish embryo exhibit an oxidation peak at 0.2 V associated with the oxidation of dopamine. After the addition of nomifensine in the near proximity of the embryo, the dopamine oxidation peak is increasing. (B) Average dopamine concentration–time trace measured in the tectum of 5 dpf zebrafish embryos. The arrow indicates the injection of nomifensine in the near proximity of the embryos at 410 s. The error bars represent the standard error of the mean for n = 7 replicate experiments in individual embryos. (C) Comparison of normalized oxidation current–time traces for control and nomifensine addition experiments. The oxidation currents were normalized to the value measured just before the addition of the control or nomifensine sample, as indicated by the arrow. The error bars represent the standard error of the mean for “n” replicate experiments in individual embryos. (D) Comparison between the average dopamine concentrations measured before and after the addition of nomifensine. The extracellular dopamine concentration represents the average concentration measured just before the injection of nomifensine in the medium. The dopamine concentration associated with the exposure to 320 μM nomifensine is the average of the maximum dopamine concentrations after the injection of nomifensine for each single measurement. The error bars represent the standard error of the mean for n = 7 replicate experiments in individual embryos. Statistical significance is calculated using the paired t-test and it is indicated by one (*) and two (**) asterisks at p < 0.05 and p < 0.01, respectively. |
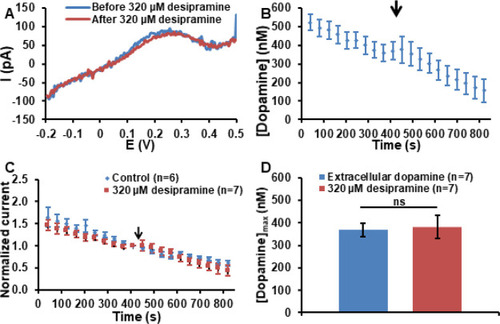
(A) Typical DPVs recorded at the implantation site in a 5 dpf zebrafish embryo exhibit an oxidation peak at 0.2 V associated with the oxidation of dopamine. After the addition of desipramine in the near proximity of the embryo, the dopamine oxidation peak intensity does not show a significant change. (B) Average dopamine concentration–time trace measured in the tectum of 5 dpf zebrafish embryos. The arrow indicates the injection of desipramine in the near proximity of the embryos at 410 s. The error bars represent the standard error of the mean for n = 7 replicate experiments in individual embryos. (C) Comparison of normalized oxidation current–time traces for control and desipramine addition experiments. The oxidation currents were normalized to the value measured just before the addition of the control or desipramine sample, as indicated by the arrow. The error bars represent the standard error of the mean for “n” replicate experiments in individual embryos. (D) Comparison between the average dopamine concentrations measured before and after the addition of desipramine. The extracellular dopamine concentration represents the average concentration measured just before the injection of desipramine in the medium. The dopamine concentration associated with the exposure to 320 μM desipramine is the average of the maximum dopamine concentrations after the injection of desipramine for each single measurement. The error bars represent the standard error of the mean for n = 7 replicate experiments in individual embryos. Statistical significance is calculated using the paired t-test and it is indicated by “ns” for no statistical significance. |
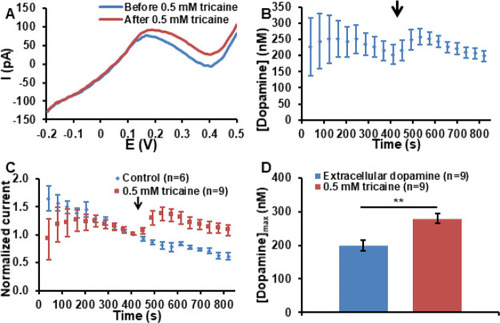
(A) Typical DPVs recorded at the implantation site in a 5 dpf zebrafish embryo exhibits an oxidation peak at 0.2 V associated with the oxidation of dopamine. After the addition of tricaine in the near proximity of the embryo, the dopamine oxidation peak is increasing. (B) Average dopamine concentration–time trace measured in the tectum of 5 dpf zebrafish embryos. The arrow indicates the injection of tricaine in the near proximity of the embryos at 410 s. The error bars represent the standard error of the mean for n = 9 replicate experiments in individual embryos. (C) Comparison of normalized oxidation current–time traces for the control and tricaine addition experiments. The oxidation currents were normalized to the value measured just before the addition of the control or tricaine sample, as indicated by the arrow. The error bars represent the standard error of the mean for “n” replicate experiments in individual embryos. (D) Comparison between the average dopamine concentrations measured before and after the addition of tricaine. The extracellular dopamine concentration represents the average concentration measured just before the injection of nomifensine in the medium. The dopamine concentration associated with the exposure to 0.5 mM tricaine is the average of the maximum dopamine concentrations after the injection of tricaine for each single measurement. The error bars represent the standard error of the mean for n = 9 replicate experiments in individual embryos. Statistical significance is calculated using the paired t-test and it is indicated by one (*) and two (**) asterisks at p < 0.05 and p < 0.01, respectively. |