
- Title
-
CRISPR-dCas13-tracing reveals transcriptional memory and limited mRNA export in developing zebrafish embryos
- Authors
- Huang, Y., Gao, B.Q., Meng, Q., Yang, L.Z., Ma, X.K., Wu, H., Pan, Y.H., Yang, L., Li, D., Chen, L.L.
- Source
- Full text @ Genome Biol.

Imaging ectopic GCN4 RNA repeats by CRISPR-dCas13 in zebrafish embryos. a A schematic screen to identify robust CRISPR-dCas13 systems to visualize RNAs in zebrafish embryos. 5.6 μM dCas13-EGFP protein assembled with 8.4 μM in vitro transcribed gRNA (gGCN4) at a molar ratio 1:1.5, plus 5.9 nM (50 ng/μL) β-actin-48× GCN4 plasmid were injected into zebrafish embryos at the 1-cell stage. For some lower stability dCas13 constructs, we increased the concentration (see “Methods”). After injection, fluorescent signals in the nucleus were detected at 6–10 hpf (hours post fertilization). The CRISPR-dCas13 detected signals were confirmed by smFISH. β-actin-48× GCN4, zebrafish β-actin promoter derives 48× GCN4 expression. b A schematic view of chemically modified gRNA. Cyanine 3 (Cy3) and 2′-O-methyl 3′ phosphorothioate (MS) modifications at the 5′ and/or 3′ end of gGCN4 were used, including MS-gGCN4, Cy3-gGCN4, Cy3+MS-gGCN4 and gGCN4-Cy3. The gRNA of dCas13b consists of a 5′ spacer sequence (blue region) and a 3′ direct repeat sequence (DR, red region) [43]. c–f Chemically modified gRNA improves CRISPR-dCas13 in RNA labeling. Representative images of CRISPR-dPspCas13b system-labeled 48× GCN4 with gGCN4 (no modification, c), MS-gGCN4 (d), Cy3-gGCN4 (e), and Cy3+MS-gGCN4 (f) at 6 hpf in live embryos, respectively. White arrowheads indicate labeled signals (c–f) and colocalization signals between Cy3 and EGFP (e, f). g SNR statistics of the 48× GCN4 signals labeled by unmodified and chemically modified of gGCN4 with dPspCas13b-EGFP. Data from about 10 embryos in each group, n = 71, 80, 73, 74 cells. h smFISH confirms the CRISPR-dPspCas13b system targeting 48× GCN4 at 8 hpf in fixed embryos. White arrowheads indicate colocalization of GCN4 smFISH, Cy3-gGCN4, and dPspCas13b-EGFP. White arrows indicate non-specific signals. Blue box, zoomed in i. i Analysis of the blue box region in h. Line scan of the relative fluorescence intensity of signals (white dot line arrow in upper panel) shows the colocalization of Cy3-gGCN4, dPspCas13b-EGFP, and smGCN4 FISH. Scale bar 2 μm. In c-f and h, data scale bar 20 μm; the white box indicates magnified area, scale bar 5 μm. In g, data is represented as mean ± SD, unpaired two-tail Student’s t test, **** p< 0.0001 |

Single- and dual-color labeling endogenous mRNAs using CRISPR-dCas13 systems. a A pipeline to identify endogenous transcripts for dCas13 targeting. See also Additional file 1: Fig. S4a, b. b A schematic of the eppk1 locus, which contains two exons. The transcript of eppk1 is predicted to be about 16,900 nt and exon 2 contains 12 repeated units of about 1000 nt each. Three modified geppk1s were designed to target each unit. c Representative images of eppk1 expression examined by WISH at 5.3 hpf, shown as the lateral (left) and dorsal (middle) views. A schematic eppk1 expression in enveloping layer (EVL) cells is shown on right. d Representative images of the CRISPR-dPspCas13b system-labeled eppk1 at 6 hpf in live embryos. White arrowheads indicate the colocalization between dPspCas13b-EGFP and Cy3-geppk1s. e smFISH confirms the CRISPR-dPspCas13b system-labeled eppk1 at 8 hpf in fixed embryos. White arrowheads indicate the colocalization of eppk1 smFISH, dPspCas13b-EGFP and Cy3-geppk1s. In some cells, four transcription sites (two pairs of signal spots) could be detected at two alleles. Blue box, zoomed in f. f Analysis of the blue box region in e. Line scan of the relative fluorescence intensity of signals (white dot line arrow in upper panel) shows the colocalization of Cy3-geppk1s, dPspCas13b-EGFP, and eppk1 smFISH. Scale bar 2 μm. g–i Representative images of the CRISPR-dRfxCas13d system-labeled eppk1 (white arrowheads) with geppk1s-MS at 6 hpf in live embryos (g), confirmed by smFISH (white arrowheads) in h and i. See d–f for details. j Mean SNR statistics of eppk1 signals labeled by Cy3-geppk1s with dPspCas13b-EGFP and geppk1s-MS with dRfxCas13d-EGFP. Data from four independent experiments. Of note, the spacer on the gRNA of PspCas13b and RfxCas13d is at the 5′ and 3′ end, respectively [43]. k A schematic view of CRISPR-dPspCas13b-EGFP and CRISPR-dRfxCas13d-mScarlet systems to label two endogenous mRNAs in dual color with MS-modified gRNAs. l Representative images of muc5.1 mRNA (green arrowheads) and eppk1 mRNA (white arrowheads) labeled by dPspCas13b and dRfxCas13d systems at 10 hpf in live embryos, respectively. m Representative images of 100537515 mRNA (green arrowheads) and eppk1 mRNA (white arrowheads) labeled by dPspCas13b and dRfxCas13d at 10 hpf in live embryos, respectively. In d, e, g, and h, data scale bar 20 μm; the white box indicates magnified area, scale bar 5 μm. In (l and m), data scale bar 5 μm. In j, data is represented as mean ± SD, unpaired two-tail Student’s t test, ns, not significant |

Non-synchronized de novo transcription in developing zebrafish embryos. a A schematic of time-lapse imaging of eppk1 and 100537515 gene expressions in different cell cycles of developing embryos. About 70 image stacks were recorded every 2 min during cell cycle 12–13 from 3.3 to 6 hpf, or every 5 min during cell cycle 14 from 4 to 10 hpf, and cell cycle 15 from 9.5 to 13 hpf. The image stacks were 0.4 μm z-step distance and then were analyzed by maximum intensity projection. b Representative images of dPspCas13b-EGFP tracking de novo transcription of eppk1 with Cy3-geppk1s, recorded every 2 min from 4 to 6 hpf during EVL of cell cycle 13, see also Additional file 7: Movie 3. Green arrowheads indicate puncta 1, referred to as the first detected initial transcription site in each cell throughout the study, and magenta arrowheads indicate puncta 2, the later initial transcription site in each cell throughout the study. c Non-synchronized de novo transcription of inter-alleles at eppk1 in developing zebrafish embryos. Normalized intensity at the transcription sites recorded over time in b. Puncta 1 and 2 are indicative of the two transcription sites. Initial expression of puncta 1 and puncta 2 are asynchrony. Transcriptional burst shows switching a promoter from activated state to inactivated state. d Non-synchronized de novo transcription of EVL cells. Statistics of de novo transcription events of two genes eppk1 (left) and 100537515 (right) in individual cell cycles (cell cycles 13 and 14, respectively), in which their de novo transcription is first detected. Three types of de novo transcription events are recorded throughout one cell cycle: (1) only one allele is transcribed (blue); (2) two alleles are transcribed at the same time (black); (3) two alleles are transcribed sequentially (orange). See also Additional file 1: Fig. S8f, g for original data. See also Fig. 3e for detail. e Time difference in initial transcription between individual inter-alleles of eppk1 and 100537515 during de novo expression in cell cycles 13 and 14, respectively. See also Additional file 1: Fig. S8f, g for original data. Data are represented as mean ± SD |
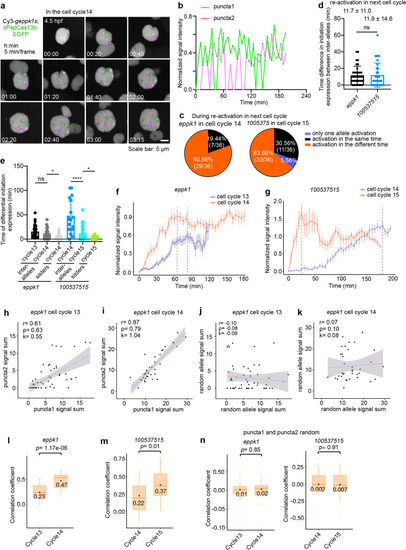
Inheritance of active transcriptional states propagating through cell division. a Representative images of dPspCas13b-EGFP tracking eppk1 re-activation with Cy3-geppk1s, recorded every 5 min from 4.5 to 8 hpf in EVL of cell cycle 14. See also Additional file 7: Movie 7. Green arrowheads indicate puncta 1, and magenta arrowheads indicate puncta 2. b Synchronized transcription of inter-allelic eppk1 in the cell cycle post the cell cycle having de novo transcription. Normalized signal intensity of transcriptional activity recorded over time in a in the EVL of cell cycle 14 in developing embryos. c Synchronized post-mitotic transcriptional re-activation of EVL cells. Statistics of the inherited active transcriptional sites of two genes eppk1 (left) and 100537515 (right) during re-activation in the next cell cycles (the EVL of cell cycles 14 and 15, respectively). Data were traced from Additional file 1: Fig. S9c, d for original data. See also Fig. 4d for detail. d Time difference in initial transcription between individual inter-alleles of eppk1(left) and 100537515 (right) during transcription re-activation in the next cell cycles (the EVL of cell cycles 14 and 15, respectively). Data were traced from Additional file 1: Fig. S9c, d. See also Additional file 1: Fig. S9f. e Inherited active transcriptional states propagating through cell division. Statistics of the time difference in initial transcription between inter-alleles, and among pairs of sister cells for eppk1 and 100537515 during de novo transcription and post-mitotic re-activation in different cell cycles. See also Figs. Figs.3e,3e, 4d and Additional file 1 Fig. S9f-h. f, g Rapid kinetics of post-mitotic transcriptional re-activation. Expression of both eppk1 (f) and 100537515 (g) is more rapidly re-activated and reached a transcriptional plateau in the post de novo transcription cell cycle of EVL cells. Normalized intensity in all cells (eppk1, n= 55 in the cell cycle 13, 0 time point indicating 4 hpf; n= 36 in the cell cycle 14, 0 time point indicating 4.5 hpf. 100537515 n= 24 in the cell cycle 14, 0 time point indicating 6 hpf; n = 36 in the cell cycle 15, 0 time point indicating 9.5 hpf) at each time point across de novo expression (cell cycle 13 for eppk1, and cell cycle 14 for 100537515) and post-mitotic transcriptional re-activation (cell cycle 14 for eppk1, and cell cycle 15 for 100537515) cell cycles. Sum of puncta 1 and puncta 2 for one cell transcriptional activity at each time point. Of note, the non-synchronized transcription of 100537515 inter-alleles in cell cycle 14 can be used as a control for the synchronized transcription of eppk1 inter-alleles in the same cell cycle, and vice versa. Data were traced from Additional file 1: Fig. S8f, g and S9c, d for original data. h–k Scatterplot of transcriptional output of pairs allelic eppk1 in the same cells (h, i) and random pairs allelic eppk1 from the different cells (j, k) during EVL cell cycles 13 (h, j) and 14 (i, k), respectively. Total RNA output was determined by summing the area under the time point traced at each allele (data from Additional file 1: Fig. S8f,9c). r: Pearson correlation coefficient, ρ: Spearman’s rank correlation coefficient, k: Slope. The pink line in each panel indicates slope. l, m Increased inter-allelic correlations of eppk1 (l) and 100537515 (m), respectively, during post-mitotic transcriptional re-activation, compared with those during de novo expression. Statistics of the Pearson correlation coefficient of all cells (eppk1, n = 55 in the cell cycle 13; n = 36 in the cell cycle 14. 100537515 n = 24 in the cell cycle 14; n = 36 in the cell cycle 15) at each time point. See also Additional file 1: Fig. S11e-h. Pearson correlation coefficient in real time. eppk1, p = 1.17e−06; 100537S515, p = 0.01. Data were traced from Additional file 1: Fig. S8f, g and S9c, d for original data. n The transcriptional activity has no difference in random pairs of eppk1 (left panel) and 100537515 (right panel) alleles from different cells between de novo expression and post-mitotic transcriptional re-activation, shown by Pearson correlation coefficient. eppk1, p = 0.85; 100537515, p = 0.91. In d–g, data are represented as mean ± SD. In d, e, data unpaired two-tail Student’s t test; ns, not significant; * p< 0.05, **** p< 0.0001. In l–n, data of the box, middle line is median; upper and lower horizontal lines are 25% and 75% quartiles respectively; the point is mean; unpaired two-tail Student’s t test |
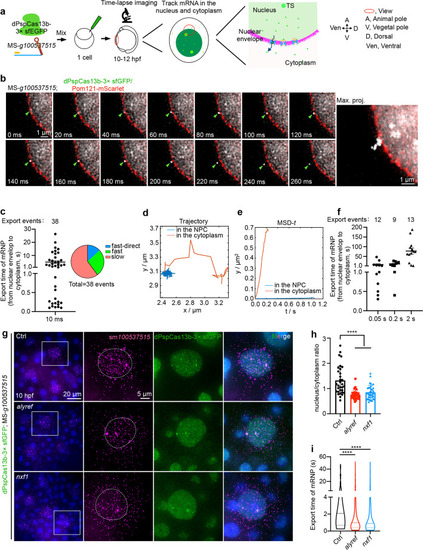
dPspCas13b/100537515 mRNP export via different patterns, which are modulated by Alyref and Nxf1. a A schematic view of the CRISPR-dPspCas13b tracked 100537515 mRNP motion in the nucleus and cytoplasm by time-lapse imaging. b Representative images of dPspCas13b-engaged 100537515 mRNP export, recorded every 10 ms. Pom121-mScarlet marks nuclear pore complexes (NPCs). Right panel, maximum time projection (max. proj.) of the movie shows the trajectory of mRNP export. Green arrowheads indicate mRNPs, see also Additional file 7: Movie 14. c Time of dPspCas13b/100537515 mRNP export displays a wide range. Left panel, graph depicting export time of all tracked mRNPs (n= 38) varies from 0.10 to 30 s. Right panel, graph shows the types of export events, including fast transport into cytoplasm less than 1 s (n=10) with directed transport via linearly traveling into cytoplasm (n=5), and slow transport into cytoplasm more than 1 s (n=23). d Graph depicting trajectory of slow transport event translocating from the nuclear envelope to the cytoplasm, with a significant dwell duration inside the nuclear envelope. e Two types of motions of mRNPs shown by the mean square displacement (MSD) of tracked export event in d versus time. The presence of two types of motions: diffusive movement (red line) in the cytoplasm and stationary diffusion (blue line) transporting through nuclear pore. f Time of dPspCas13b/100537515 mRNP export displays a wider range. Export time requirements of tracked mRNPs adopt different interval time for imaging, including 0.05 s (n = 12 from 38 cells), 0.2 s (n = 9 from 37 cells), and 2 s (n = 13, from 49 cells), ranging from 0.3 to 180 s. g Alyref and Nxf1 promotes mRNP export in developing embryos. Representative images of smFISH of 100537515 mRNP distribution in the nucleus and cytoplasm after injected the CRISPR-dPspCas13b system with transport factors mRNA, alyref and nxf1 at 10 hpf in fixed embryos. Scale bar 20 μm; white box indicates magnified area, scale bar 5 μm. h Statistical analyses show that Alyref and Nxf1 promotes mRNP export in developing embryos. Graph depicting nuclear/cytoplasm ratio of 100537515 mRNA in different group of examined EVL cells from about 10 developing embryos in g; n = 32, 33, 34 cells. i Alyref or Nxf1 overexpression shortens the time of dPspCas13b/100537515 mRNP export. The mRNPs were recorded at 50 ms per frame resolution. Export events: Ctrl, n = 86 (from 231 cells); alyref, n = 142 (from 255 cells); nxf1, n = 112 (from 272 cells). Mann-Whitney test was used; center dotted line, median; upper and lower dotted lines, 25% and 75% quartiles; **** p < 0.0001. In c, f, data are represented as mean ± SEM. In h, data are represented as mean ± SD; unpaired two-tail Student’s t test; **** p < 0.0001. Ctrl, control |