
- Title
-
Phase-separated Liposomes Hijack Endogenous Lipoprotein Transport and Metabolism Pathways to Target Subsets of Endothelial Cells in vivo
- Authors
- Arias-Alpizar, G., Papadopoulou, P., Rios, X., Pulagam, K.R., Moradi, M.A., Pattipeiluhu, R., Bussmann, J., Sommerdijk, N., Llop, J., Kros, A., Campbell, F.
- Source
- Full text @ Adv. Healthc. Mater.
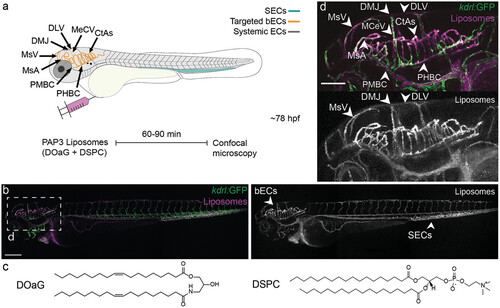
Biodistribution of PAP3 liposomes within zebrafish embryos (78 hpf). a) Schematic zebrafish larvae in lateral (whole-body) view, showing the site of microinjection and key cranial vessels. Fluorescently labeled liposomes are imaged with confocal microscopy after 60–90 min. The vasculature is as follows, liposome targeted bECs in yellow and systemic endothelium in dark gray, scavenger endothelial cells (SECs) in cyan, at ≈78 h post-fertilization (hpf). b) Biodistribution (10x magnification, lateral view) of PAP3 liposomes within a Tg(kdrl:GPF) zebrafish embryo at 1.5 h post-injection (hpi). c) Chemical structure of lipids used in the equimolar mixture for the formulation of PAP3 liposomes, DOaG, and DSPC lipids. d) Zoom of the cranial region in lateral view. bECs, brain endothelial cells; CtAs, central arteries; DLV, dorsal longitudinal vein; DMJ, dorsal midline junction; MCeV, middle cerebral vein; MsA, mesencephalic artery; MsV, mesencephalic vein; PMBC, primordial midbrain channel; PHBC, primordial hindbrain channel; SECs, scavenging endothelial cells. Liposomes formulated by extrusion (5 mM, 0.2% mol DOPE-LR). Scale bars: 200 µm (lateral view) and 100 µm (zoom).
|

Biodistribution of PAP3 liposomes within the head region of zebrafish embryos. a) Schematic zebrafish larvae with key blood vessels in different planes of view. See Figure S1a,b, Supporting Information for a Z-stacks depth color-coded zebrafish vasculature. Dorsal view, showing the i) top, ii) middle, and iii) bottom layer diagram. The vasculature is as follows, targeted brain endothelial cells (bECs) in yellow and non-targeted systemic endothelium in dark gray, at ≈78 h post-fertilization (hpf). PHBC, primordial hindbrain channel; CtA, central artery; DLV, dorsal longitudinal vein; MsA, mesencephalic artery; MsV, mesencephalic vein; MMCtA, middle mesencephalic central artery. b) Biodistribution (10x magnification, dorsal view, 1.5 hpi) of PAP3 liposomes (5 mM, 0.2% mol DOPE-LR) within the head region of a Tg(kdrl:GFP) zebrafish embryo at 54, c) 78, and d) 102 hpf. e) High magnification view of c) (inset, 40x, zoom) showing PAP3 liposomes accumulating within bECs. f) Posterior part of the PHBC, g) DLV, h) CtA, i) MMCtA. j,k) Biodistribution of PAP3 liposomes in a Tg(cldn5a:GFP)42 zebrafish embryo (102 hpf) with GFP-labeling in blood and choroid plexus brain barrier showing colocalization of cldn5a with fluorescent liposomes. Zoom-in of the region that includes the hindbrain vasculature and colocalization with cldn5a expression is shown in Figure S1c, Supporting Information. Liposomes formulated by extrusion (5 mM, 0.2 mol% DOPE-LR). Scale bars: 100 µm (dorsal view), 50 µm (tissue level).
|
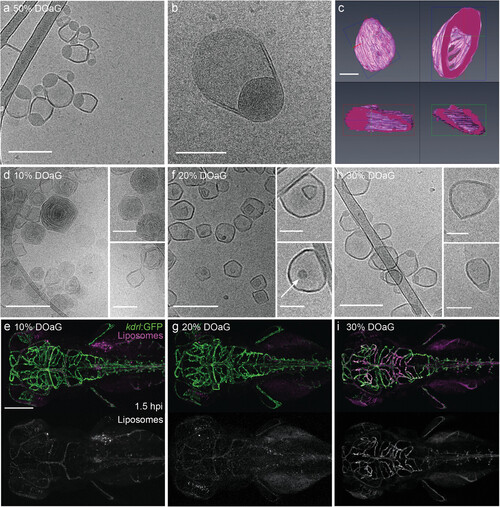
Cryo-TEM of PAP3 liposomes characterized by phase separation correlates with the bECs targeting in zebrafish larvae (≈78 hpf). a,b) CryoTEM of PAP3 (50–50 mol% DOaG-DSPC) liposomes and c) 3D model of a representative PAP3 liposome reconstructed based on the electron density derived from cryo-electron tomography, demonstrating the whole body and different plane sections of the particle. CryoTEM and biodistribution (in a Tg(kdrl:GFP) zebrafish embryo at 1.5 hpi) of liposomes containing DSPC and d,e) DOaG 10 mol%, f,g) 20 mol%, and h,i) 30 mol%. Liposomes (5 mM, 0.2% mol DOPE-LR) described in all panels formulated by ethanol injection except panels (b) and (c) – formulated by extrusion. Scale bars: 200 nm and 100 nm for higher magnification insets for CryoTEM, 100 nm for 3D reconstruction, and 200 µm for dorsal zebrafish view.
|
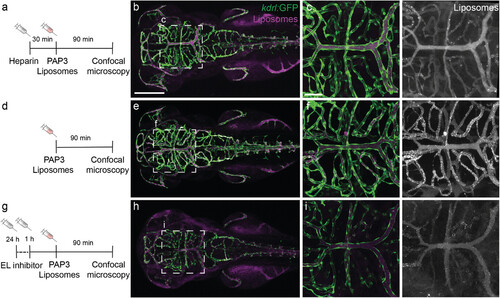
bECs targeting by PAP3 liposomes is inhibited by heparin and an EL lipase inhibitor. a) Timeline of injection and imaging. b,c) Biodistribution (10x and 40x magnification) of PAP3 liposomes at 1.5 hpi, after heparin (1 nl, 50 mg ml−1) administration. d) Timeline of injection and imaging. e,f) Biodistribution (10x and 40x magnification) of PAP3 liposomes, as a reference, at 1.5 hpi. g) Timeline of injection and imaging. h,i) Biodistribution (10x and 40x magnification) of PAP3 liposomes at 1.5 hpi, after a double administration (24 and 1 h prior liposome injection) of an EL inhibitor (XEN445, 1 nL of 50 µM). All zebrafish larvae, Tg(kdrl:GFP) at ≈78 hpi. Liposomes (5 mM, 0.2% mol DOPE-LR) formulated by extrusion. Scale bars: 200 µm (whole embryo) and 50 µm (tissue level).
|
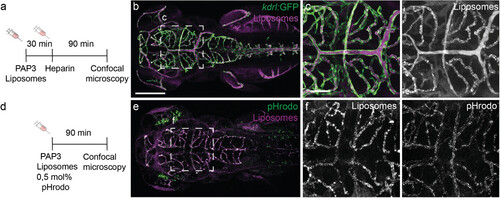
Internalization of PAP3 in zebrafish bECs. a) Timeline of injection and imaging. b,c) Biodistribution (10x and 40x magnification) of PAP3 liposomes (5 mM, 0.2 mol% DOPE-LR) after post-administration of heparin (1 nl, 50 mg ml−1) in a Tg(kdrl:GFP) zebrafish embryo at 1.5 hpi. d) Timeline of injection and imaging. e,f) Biodistribution of PAP3 liposomes (10 mM), containing 0.5 mol% of pH-sensitive DOPE-pHrodo (green/grey) to indicate endocytosis and 0.5 mol% of non-sensitive pH dye DOPE-NBD (magenta/grey) to label liposomes, in an AB/TL zebrafish embryo at 1.5 hpi. All zebrafish larvae at ≈78 hpi. Liposomes formulated by extrusion. Scale bars: 200 µm (whole embryo) and 50 µm (tissue level).
|

Biodistribution of radiolabeled PAP3 liposomes in mice. a) Representative positron emission tomography (PET) images (coronal projections) obtained at 0–1, 1–5, 5–10, 10–30 min, and 2 and 6 h after injection of radiolabeled PAP3 liposomes containing 0.2 mol% of 64Cu-NOTA-Bz-SCN-C18 in 6–8 weeks male mice treated (or not treated) with XEN445 (30 mg kg−1 orally, b.i.d. for 9 days) prior to liposomal injection (n = 2 per group and timepoint). PET images have been co-registered with representative CT slices for anatomical localization of the radioactive signal. b) Ex vivo gamma radiation counter of plasma in mice treated (or not treated) with XEN445. Concentration of radioactivity in plasma at 10 min, 2h, and 6h after i.v. administration of radiolabeled PAP3 liposomes (n = 3 per time point). c) Ex vivo gamma radiation counter of liver and spleen in mice treated (or not treated) with XEN445 at 10 min, 2h, and 6h after i.v. administration of radiolabeled PAP3 liposomes (n = 3 per group and time point). Statistical significance was evaluated using a two-tailed unpaired Student's t-test. ns: not significant (p > 0.05). Significantly different *p < 0.05, **p < 0.01; ***p < 0.001. Exact p-values for b: 0.2379, 0.0242, and 0.1095. Exact p-values for c: 0.0259, 0.0029, and 0.0103 at 10 min, 2 h, and 6 h respectively for the liver and 0.5668, 0.5323, and 0.4659 for the spleen.
|