FIGURE SUMMARY
Title

Preparation and Characterization of Ginger Peel Polysaccharide-Zn (II) Complexes and Evaluation of Anti-Inflammatory Activity

Authors
Li, W., Qiu, Z., Ma, Y., Zhang, B., Li, L., Li, Q., He, Q., Zheng, Z.
Source
Full text @ Antioxidants (Basel)

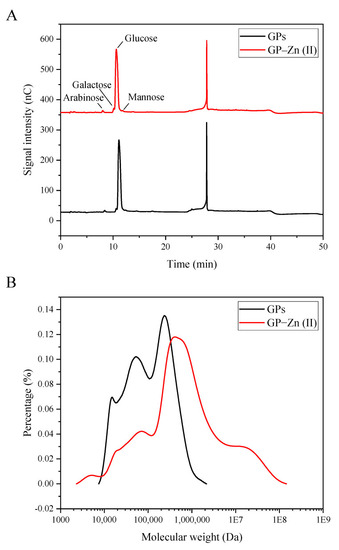
Monosaccharide profile (A) and molecular weight distribution (B) of ginger peel polysaccharide (GPs) and their Zn (II) derivatives.

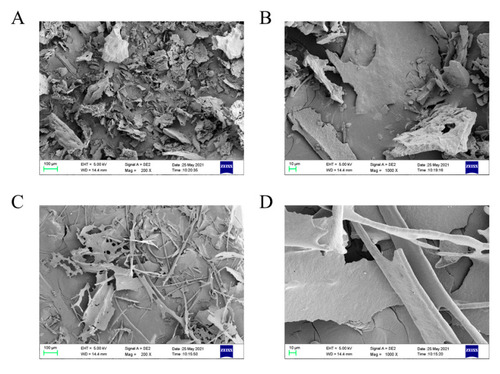
Morphological features of GPs and their Zn (II) derivatives. (
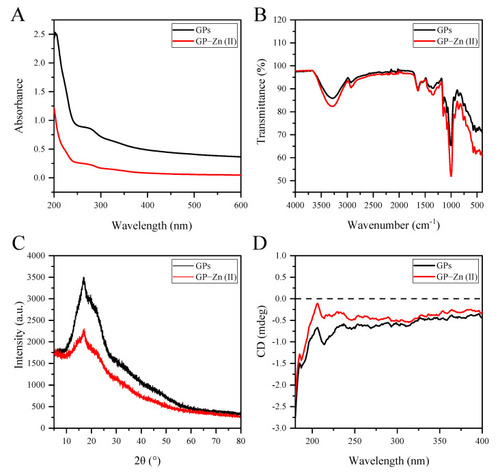
A,B) SEM images of GPs at magnifications of 200× and 1000×, respectively; (C,D) SEM images of GP–Zn (II) complexes at magnifications of 200× and 1000×, respectively.

UV-vis spectra (A), FTIR spectra (B), XRD patterns (C) and CD spectra (D) of GPs and their Zn (II) derivatives.

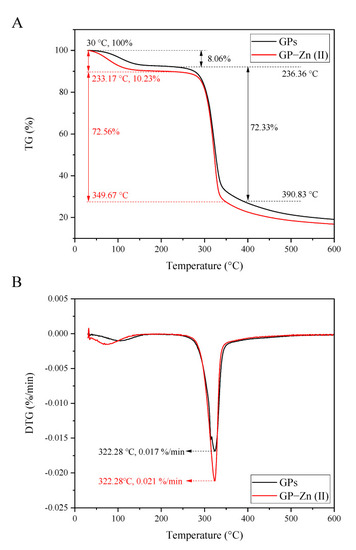
Thermodynamic analysis of GPs and GP–Zn (II) complexes. (A) TG curves; (B) DTG curves.

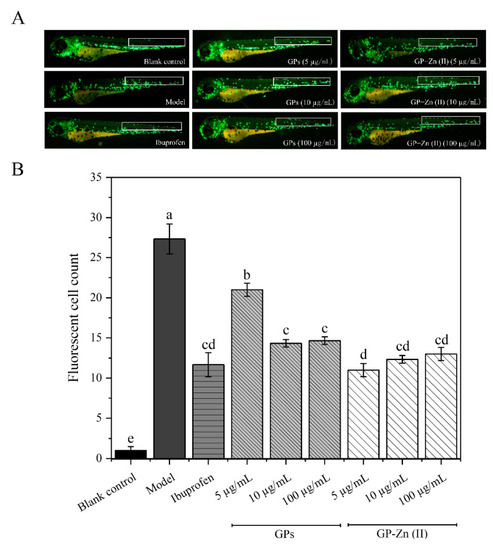
Alleviation of CuSO4-induced inflammatory response in zebrafish by GPs and their Zn (II) derivatives. (A) Representative images of zebrafish treated with CuSO4, ibuprofen and different doses of GPs and GP–Zn (II) complexes; (B) Migration of macrophages to the lateral line revealed by Image-Pro Plus software. Data are presented as mean ± standard deviation. Different letters (a, b, c and d) indicate significant differences between the number of fluorescent cells (p < 0.05).

Effect of GPs and GP–Zn (II) complexes on the expression levels of inflammation-related cytokines in zebrafish. (A) IL-1β; (B) IL-6; (C) IL-8; (D) IL-12; (E) TNF-α; (F) IL-10. Data are presented as mean ± standard deviation. Different letters (a, b, c, d and e) indicate significant differences between the expression levels of inflammatory cytokines (p < 0.05).

Acknowledgments
This image is the copyrighted work of the attributed author or publisher, and ZFIN has permission only to display this image to its users. Additional permissions should be obtained from the applicable author or publisher of the image. Full text @ Antioxidants (Basel)