FIGURE SUMMARY
Title

A novel uveitis model induced by lipopolysaccharide in zebrafish

Authors
Xiao, X., Liu, Z., Su, G., Liu, H., Yin, W., Guan, Y., Jing, S., Du, L., Li, F., Li, N., Yang, P.
Source
Full text @ Front Immunol

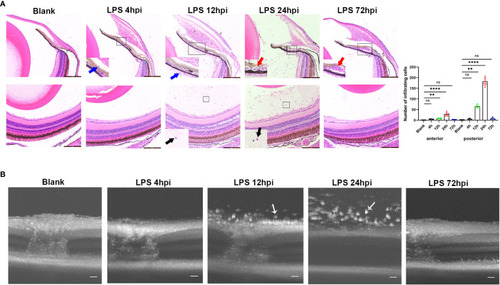
Inflammatory sign of EIU in zebrafish over time-course. (A) Left, H&E staining of eyes at different time points after LPS injection. Blue arrow, infiltrating cells around iris. Red arrow, vascular dilation. Black arrow, vitreous infiltration. Scale bars = 50μm. Right, quantification of inflammatory cells of anterior and posterior segments (mean ± SD; n = 6 eyes per group; **P < 0.01, ****P < 0.0001, ns, not significant; one-way ANOVA). (B) Serial OCT imaging of EIU at various time points after LPS injection. White arrow, highly reflex dots. Scale bars = 20μm. hpi, hours post injection.

Distribution of immune cells during EIU inflammation process in zebrafish. (A) L-plastin (magenta), Mpx (green), and DAPI (blue) staining was seen in cryosections at 0 hpi (blank control), 4 hpi, 12 hpi, 24 hpi and 72 hpi of LPS. ONL, outer nuclear layer, INL, inner nuclear layer, IPL, inner plexiform layer, GCL, ganglion cell layer. Asterisk: L-plastin+/Mpx- cell. White arrow: L-plastin+/Mpx+ cell. Scale bar: 20μm. (B) Quantification of immune cells in the iris and vitreous body at each time point (mean ± SD; *P < 0.05, **P < 0.01, ****P < 0.0001, the number of L-plastin+/Mpx- cells were compared; P < 0.05, ††P < 0.01, number of L-plastin+/Mpx+ cells were compared, one-way ANOVA).

Transcriptomic traits of EIU in zebrafish. (A) Number of DEGs at 4 hpi, 12 hpi, 24 hpi and 72 hpi of LPS and saline. (B) Hierarchical clustering heatmap of DEGs at each time point. (C) The TCseq package was used to illustrate the patterns of dynamic changes in DEGs during EIU in zebrafish. (D) Functional enrichment analysis of DEGs in different clusters. Networks of pathways and genes in Cluster 1, Cluster 2, Cluster 3 and Cluster 4 were conducted by ClueGO and displayed by Cytoscape. Circles shown in the same color represent similar enrichment results.

RT-PCR validation of DEGs in the initial of inflammation (mean ± SD; *P < 0.05, **P < 0.01, ***P < 0.001, ns, not significant; one-way ANOVA).

Prednisone immersion treatment inhibited EIU inflammation in zebrafish. (A) Live cells were separated out from the retina cell suspensions of Tg(Mpx:GFP) line. Left, Flow cytometry was used to analyze the GFP-positive neutrophils. Right, quantification of percentages of GFP-positive cells in different conditions (n = 4 per group; mean ± SD; ***P < 0.001; ****P < 0.0001; ns, not significant; one-way ANOVA). (B) Left, flat mounts of retina around the optic disc in Tg(Mpx:GFP) line. Scale bar, 20μm. Right, quantification of the relative GFP-positive area in retinal flat mounts in different conditions (mean ± SD; n = 3 retinas per group; ****P < 0.0001; one-way ANOVA). (C) Transcript levels of proinflammatory genes of retina in zebrafish treated with 0.1% DMSO (vehicle-treated group) or 50μm prednisone (mean ± SD; *P < 0.05, **P < 0.01, ***P < 0.001, ****P < 0.0001; unpaired t-test).

Acknowledgments
This image is the copyrighted work of the attributed author or publisher, and ZFIN has permission only to display this image to its users. Additional permissions should be obtained from the applicable author or publisher of the image. Full text @ Front Immunol