IMAGE

Figure 1

ID
ZDB-IMAGE-221220-15
Source
Figures for Xiao et al., 2022
Image
Figure Caption

Figure 1

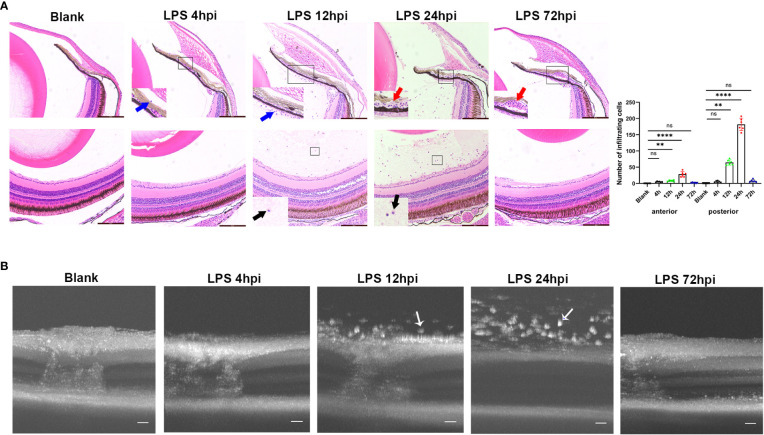
Inflammatory sign of EIU in zebrafish over time-course. (A) Left, H&E staining of eyes at different time points after LPS injection. Blue arrow, infiltrating cells around iris. Red arrow, vascular dilation. Black arrow, vitreous infiltration. Scale bars = 50μm. Right, quantification of inflammatory cells of anterior and posterior segments (mean ± SD; n = 6 eyes per group; **P < 0.01, ****P < 0.0001, ns, not significant; one-way ANOVA). (B) Serial OCT imaging of EIU at various time points after LPS injection. White arrow, highly reflex dots. Scale bars = 20μm. hpi, hours post injection.

Acknowledgments
This image is the copyrighted work of the attributed author or publisher, and ZFIN has permission only to display this image to its users. Additional permissions should be obtained from the applicable author or publisher of the image. Full text @ Front Immunol