
- Title
-
Wolfram syndrome 1b mutation suppresses Mauthner-cell axon regeneration via ER stress signal pathway
- Authors
- Wang, Z., Wang, X., Shi, L., Cai, Y., Hu, B.
- Source
- Full text @ Acta Neuropathol Commun

wfs1a and wfs1b genes in zebrafish larvae. a–f Expression pattern of wfs1b as shown by whole-mount in situ hybridization. a′–f′ were the images of wfs1b expression in the brain of zebrafish larvae. g–l Expression pattern of wfs1a as shown by whole-mount in situ hybridization. g′–l′ were the images of wfs1a expression in the brain of zebrafish larvae. The dorsal view (scale bar, 5 μm) and lateral view (scale bar, 10 μm) of the zebrafish larvae at different stages showed that wfs1b is expressed in the CNS (red arrows) as well as wfs1a. m The predicted protein structure of WFS1 between human and zebrafish. n The phylogenetic tree with the maximum-likelihood algorithm. The numbers represent the length of the evolutionary branch and it determines the degree of homology, Wfs1b has a shorter distance compared to Wfs1a, which means Wfs1b has higher evolutional conservation |

Generation and identification of wfs1b mutant zebrafish. a Schematic of the Cas9-sgRNA targeted site located at the second exon of wfs1b. b schematic of the complex injected into one-cell embryos. c, d Representative sequencing results of wide-type and mutated zebrafish lines. The mutant sequencing result showed a 23-bp base deletion. e Bioinformatics analysis indicated that the mutated region is located in the front of the functional domain of Wfs1b. The wildtype translated to 895 amino acids, whereas the mutant translated to 59 normal amino acids. f, g Western-blotting analysis showed that WFS1 protein expression is inhibited in the mutant group compared with that of the wildtype. The protein expressions were quantified by Image J software. The experiment was repeated three times with three independent samples. P = 0.0394. Assessed by unpaired t test |

Wfs1b regulates M-cell axon regeneration in vivo. a Hybridization of the transgenic line: Tg (Tol 056: EGFP) and wfs1b mutants were crossed for two consecutive generations to obtain Tg (Tol 056: EGFP)/ wfs1b +/- and Tg (T056: EGFP); wfs1b −/− lines. b Representative images of the M-cell axon before and after ablations by a two-photon laser. Asterisk, injury site; arrowhead, cloacal pore; scale bar, 50 μm. c, d Confocal imaging of M-cell axons between wfs1b+/+ and wfs1b−/− groups at 8 dpf and the regeneration length at 2 dpa. Violin plot shows all data points, including minimum, maximum, median, and quartiles. Scale bar, 20 μm, P < 0.0001, control, n = 24; wfs1b−/−, n = 26. Assessed by unpaired t test. e, f Representative images of embryos from the wildtype and the mutant at 6 dpf (scale bar, 500 μm), and measured total body length from 4 to 6 dpf before axotomy (4 dpf, wildtype: 3.603 ± 0.01402 cm, wfs1−/−: 3.549 ± 0.02201 cm, P = 0.1708; 5 dpf, wildtype: 3.745 ± 0.01504 cm, wfs1−/−: 3.727 ± 0.01679 cm, P = 0.8255; 6 dpf, wildtype: 3.790 ± 0.01691 cm, wfs1−/−: 3.806 ± 0.01569 cm, P = 0.8842; n = 30). Assessed by two-way ANOVA. ns, not significant. g, h Defined lengths of M-cell axons from the cloaca to the end were not notably different among WT, homozygous, and heterozygous larvae (wfs1b+/+: 1042 ± 19.51 μm; wfs1b+/-: 985.2 ± 21.47 μm, P = 0.0689; wfs1b−/−: 995.6 ± 21.98 μm, P = 0.1363; n = 9). Assessed by ordinary one-way ANOVA/Tukey’s multiple-comparisons test (wfs1b+/+ versus wfs1b+/-: P = 0.1594; wfs1b+/+ versus wfs1b−/−: P = 0.2856; wfs1b+/- versus wfs1b−/−: P = 0.9342) White asterisk: ablation point. Scale bar, 20 μm. ns, not significant |

Escape Behavior Test Exhibited the Impaired Function of M-cell. a Device for testing escape behavior. b Representative images of the original orientation and maximal turn angle position from the wfs1b+/+ and wfs1b−/−zebrafish larvae in the uninjured and injured groups. Red lines indicate the heading direction. c, d Statistical diagram of maximal turn angle, θ. uninjured: P = 0.0921 (wfs1b+/+:121.5° ± 5.879; wfs1b−/−:104.9° ± 7.200); injured: P = 0.0230(wfs1b+/+:94.44° ± 7.681; wfs1b−/−:69.31° ± 5.465); n = 10; ns, not significant. Scale bar, 1 mm. Assessed by unpaired t test. e A series of images of movement trajectory from the wfs1b+/+ and wfs1b−/−zebrafish larvae in the uninjured and injured groups. asterisk: maximal turn angle position. f, g Statistical diagram of time to maximal turn angle. uninjured, P = 0.6410 (wfs1b+/+:12.2 ± 1.879 ms; wfs1b−/−:13.6 ± 2.276 ms); injured, P = 0.0133 (wfs1b+/+:17.00 ± 1.983 ms; wfs1b−/−:25.33 ± 1.944 ms); n = 6; ns, not significant. Scale bar, 1 mm. Assessed by unpaired t test |
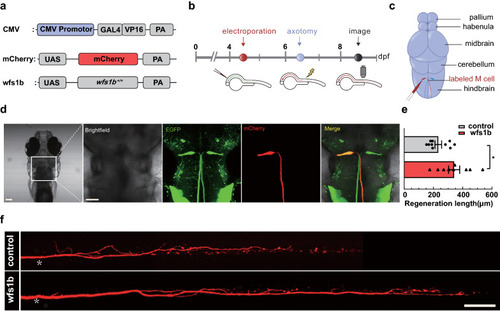
Complementation of wfs1b at single-cell electroporation promotes M-cell axon regeneration. a Construction of the wfs1b expression system. Plasmids express only mCherry served as the control vector. b Timeline of time points of electroporation, axotomy, and regeneration imaging. c Schematic of M-cell soma electroporation. d Confocal imaging of zebrafish larvae 12 h after electroporation (far left) and magnified images of the brain stem in zebrafish larvae, denoting the position of M-cell soma under different fluorescence in the white box. mCherry represents the axons that were labeled by mCherry. Scale bar, 50 μm. e, f wfs1b gene retro-complementation rescued the length of Mauthner cell axon regeneration (control: 233.1 ± 22.65 μm, n = 10; wfs1b overexpression: 341.4 ± 37.92 μm, n = 9). White asterisk: ablation point. scale bar, 50 μm. P = 0.0225. Assessed by unpaired t test |
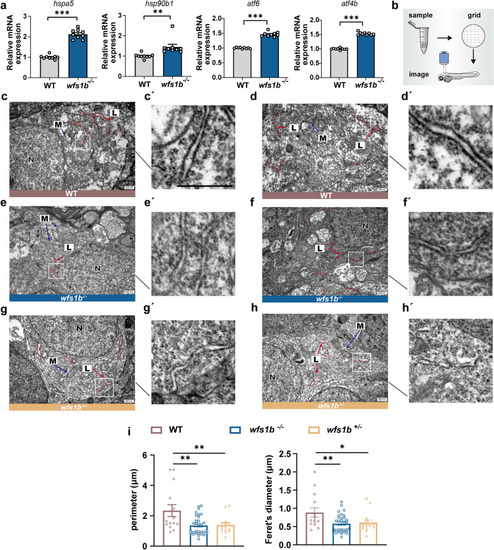
Loss of Wfs1b provokes the ER stress response. a qPCR analyses of up-regulated downstream genes of the UPR pathway. hspa5, P < 0.0001; hsp90b1, P = 0.0046; atf6, P < 0.0001; atf4b, P < 0.0001. Assessed by unpaired t test. b Diagram of the electron microscope’s operation. c–h Representative TEM imaging showed the ER morphology in wildtype (upper), wfs1b−/− mutant (middle) and wfs1b± mutant (bottom) larvae brain, indicating that the ER morphology was ruptured. (C′-H′) were the ER ultrastructure under magnification from the white boxes in c–f. Scale bar, 500 nm. L, rough endoplasmic reticulum; N, cell nuclei; M, mitochondria. i Statistical diagram of perimeter and Feret’ diameter among the wildtype, the wfs1b−/− and wfs1b+/- mutant zebrafish larvae. Assessed by ordinary one-way ANOVA |

ER Stress Response Affects M-Cell Axon Regeneration. a Timeline of time points of 4-PBA treatment, axotomy, and regeneration imaging. b, c Representative confocal imaging of Mauthner-cell axon in wfs1b+/+ treated with DMSO, wfs1b+/+ treated with 4-PBA, wfs1b−/− treated with DMSO, and wfs1b−/− treated with 4-PBA at 8 dpf and the regeneration length at 2 dpa (wfs1b+/+ + DMSO: 431.7 ± 14.12 μm, n = 28; wfs1b+/+ + 4-PBA:432.7 ± 21.63 μm, n = 15; wfs1b−/− + DMSO: 274.2 ± 25.80 μm, n = 20; wfs1b−/− + 4-PBA: 432.0 ± 29.26 μm, n = 15). Assessed by two-way ANOVA/Tukey’s multiple-comparisons test (wfs1b+/+ + DMSO versus wfs1b+/+ + 4-PBA: P > 0.9999; wfs1b+/+ + DMSO versus wfs1b−/− + DMSO: P < 0.0001; wfs1b−/− + DMSO versus wfs1b−/− + 4-PBA: P < 0.0001; wfs1b+/+ + 4-PBA versus wfs1b−/− + DMSO: P < 0.0001). Scale bar, 20 μm. ns, not significant. d–f qPCR analyses of downstream genes of the UPR pathway. Assessed by ordinary one-way ANOVA. g Timeline of time points of TM treatment, axotomy, and regeneration imaging. h, i Representative confocal imaging of Mauthner-cell axon in wfs1b+/+ treated with DMSO, wfs1b+/+ treated with TM, wfs1b−/− treated with DMSO, and wfs1b−/− treated with TM at 8 dpf and the regeneration length at 2 dpa (wfs1b+/+ + DMSO: 456.9 ± 19.27 μm, n = 21; wfs1b+/+ + TM: 323.4 ± 15.80 μm, n = 23; wfs1b−/− + DMSO: 266.1 ± 21.94 μm, n = 13; wfs1b−/− + TM: 263.2 ± 17.29 μm, n = 16). Assessed by two-way ANOVA/Tukey’s multiple-comparisons test (wfs1b+/+ + DMSO versus wfs1b+/+ + TM: P < 0.0001; wfs1b+/+ + DMSO versus wfs1b−/− + DMSO: P < 0.0001; wfs1b+/+ + DMSO versus wfs1b−/− + TM: P < 0.0001; wfs1b−/− + DMSO versus wfs1b−/− + TM: P = 0.9997). Scale bar, 20 μm. ns, not significant. j–l qPCR analyses of downstream genes of the UPR pathway. Assessed by unpaired t test. White asterisk: ablation point |
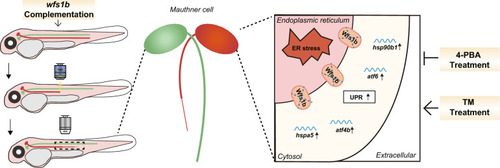
Overview of wfs1b Deficiency-Mediated ER Stress Inhibits M-cell Axon Regeneration. The wfs1b knockout impeded the M-cell axon regeneration due to increased ER stress, resulting in up-regulated mRNA expression of the UPR pathway. The ER stress activator TM inhibited M-cell axon regeneration in wfs1b+/+ zebrafish larvae, whereas both the application of ER stress inhibitor 4-PBA and complementation of wfs1b at the single-cell level ameliorated the degenerated M-cell axon in wfs1b−/− zebrafish larvae |