
|
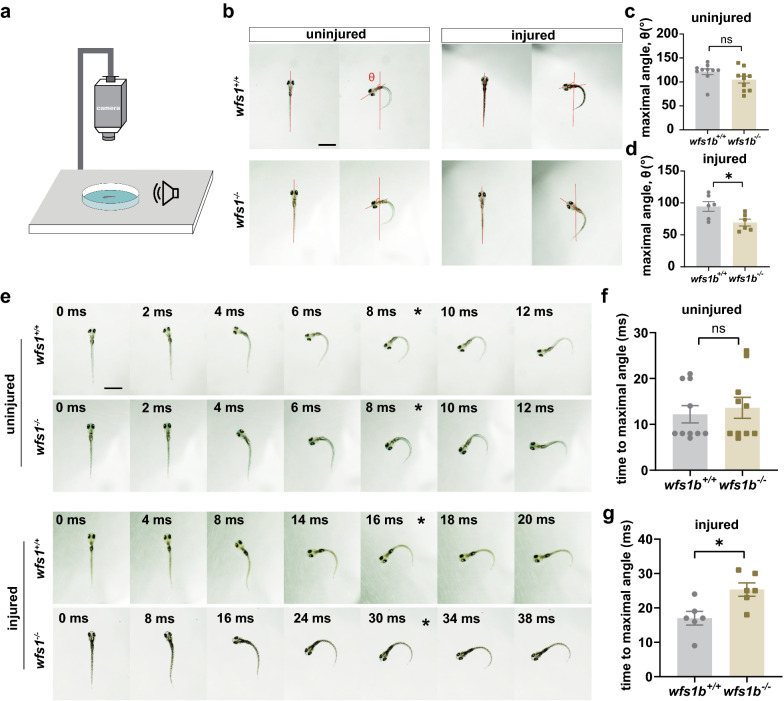
Fig. 4 Escape Behavior Test Exhibited the Impaired Function of M-cell. a Device for testing escape behavior. b Representative images of the original orientation and maximal turn angle position from the wfs1b+/+ and wfs1b−/−zebrafish larvae in the uninjured and injured groups. Red lines indicate the heading direction. c, d Statistical diagram of maximal turn angle, θ. uninjured: P = 0.0921 (wfs1b+/+:121.5° ± 5.879; wfs1b−/−:104.9° ± 7.200); injured: P = 0.0230(wfs1b+/+:94.44° ± 7.681; wfs1b−/−:69.31° ± 5.465); n = 10; ns, not significant. Scale bar, 1 mm. Assessed by unpaired t test. e A series of images of movement trajectory from the wfs1b+/+ and wfs1b−/−zebrafish larvae in the uninjured and injured groups. asterisk: maximal turn angle position. f, g Statistical diagram of time to maximal turn angle. uninjured, P = 0.6410 (wfs1b+/+:12.2 ± 1.879 ms; wfs1b−/−:13.6 ± 2.276 ms); injured, P = 0.0133 (wfs1b+/+:17.00 ± 1.983 ms; wfs1b−/−:25.33 ± 1.944 ms); n = 6; ns, not significant. Scale bar, 1 mm. Assessed by unpaired t test